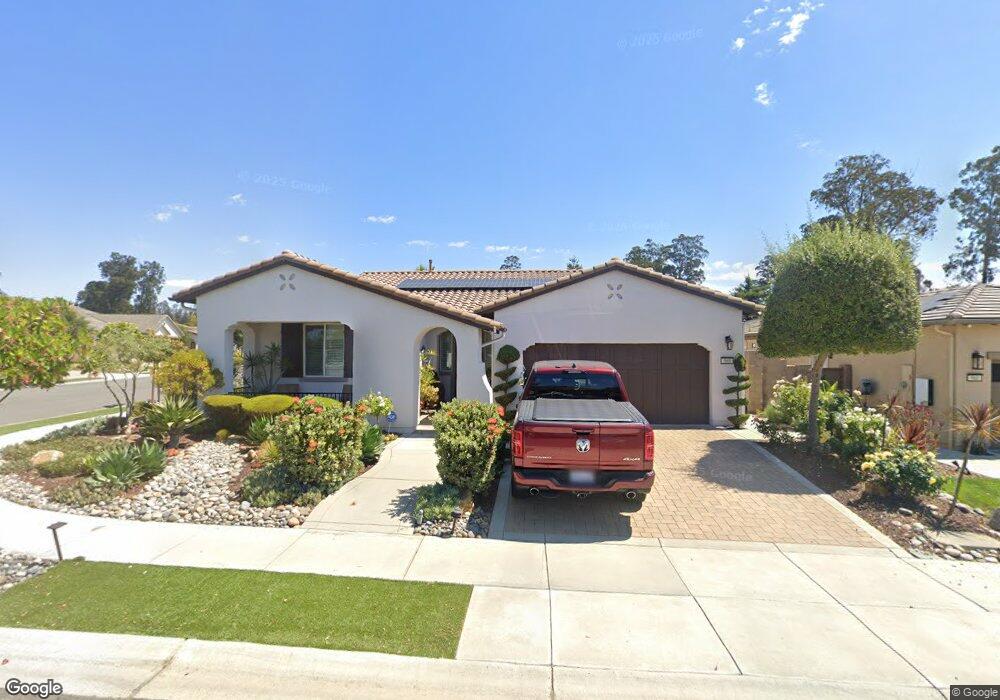
965 Allison Ct Nipomo, CA 93444
Woodlands NeighborhoodEstimated Value: $1,149,355 - $1,202,000
3
Beds
2
Baths
1,989
Sq Ft
$591/Sq Ft
Est. Value
About This Home
This home is located at 965 Allison Ct, Nipomo, CA 93444 and is currently estimated at $1,175,089, approximately $590 per square foot. 965 Allison Ct is a home located in San Luis Obispo County with nearby schools including Dorothea Lange Elementary School, Mesa Middle School, and Nipomo High School.
Ownership History
Date
Name
Owned For
Owner Type
Purchase Details
Closed on
Feb 22, 2019
Sold by
Spinelli Anthony S and Spinelli Marcia Noriega
Bought by
Spinelli Anthony S and Spinelli Marcia Noriega
Current Estimated Value
Home Financials for this Owner
Home Financials are based on the most recent Mortgage that was taken out on this home.
Original Mortgage
$596,000
Outstanding Balance
$525,258
Interest Rate
4.62%
Mortgage Type
Adjustable Rate Mortgage/ARM
Estimated Equity
$649,831
Purchase Details
Closed on
Jul 7, 2014
Sold by
Spinelli Anthony S and Spinelli Marcia N
Bought by
The Anthony & Marica Spinelli Family Tru and Spinelli Marica N
Home Financials for this Owner
Home Financials are based on the most recent Mortgage that was taken out on this home.
Original Mortgage
$571,021
Interest Rate
3.75%
Mortgage Type
FHA
Purchase Details
Closed on
Jun 3, 2009
Sold by
Shea Homes Limited Partnership
Bought by
Spinelli Anthony and Spinelli Marcia Noriega
Home Financials for this Owner
Home Financials are based on the most recent Mortgage that was taken out on this home.
Original Mortgage
$486,299
Interest Rate
4.82%
Mortgage Type
FHA
Create a Home Valuation Report for This Property
The Home Valuation Report is an in-depth analysis detailing your home's value as well as a comparison with similar homes in the area
Home Values in the Area
Average Home Value in this Area
Purchase History
| Date | Buyer | Sale Price | Title Company |
|---|---|---|---|
| Spinelli Anthony S | -- | First American Title Santa A | |
| The Anthony & Marica Spinelli Family Tru | -- | Accommodation | |
| Spinelli Anthony S | -- | Fidelity National Title Co | |
| Spinelli Anthony | $495,500 | First American Title Company |
Source: Public Records
Mortgage History
| Date | Status | Borrower | Loan Amount |
|---|---|---|---|
| Open | Spinelli Anthony S | $596,000 | |
| Closed | Spinelli Anthony S | $571,021 | |
| Closed | Spinelli Anthony | $486,299 |
Source: Public Records
Tax History
| Year | Tax Paid | Tax Assessment Tax Assessment Total Assessment is a certain percentage of the fair market value that is determined by local assessors to be the total taxable value of land and additions on the property. | Land | Improvement |
|---|---|---|---|---|
| 2025 | $6,499 | $638,942 | $290,427 | $348,515 |
| 2024 | $6,423 | $626,415 | $284,733 | $341,682 |
| 2023 | $6,423 | $614,133 | $279,150 | $334,983 |
| 2022 | $6,324 | $602,092 | $273,677 | $328,415 |
| 2021 | $6,311 | $590,287 | $268,311 | $321,976 |
| 2020 | $6,238 | $584,235 | $265,560 | $318,675 |
| 2019 | $6,199 | $572,780 | $260,353 | $312,427 |
| 2018 | $6,123 | $561,550 | $255,249 | $306,301 |
| 2017 | $6,007 | $550,541 | $250,245 | $300,296 |
| 2016 | $5,664 | $539,747 | $245,339 | $294,408 |
| 2015 | $5,582 | $531,640 | $241,654 | $289,986 |
| 2014 | $5,373 | $521,227 | $236,921 | $284,306 |
Source: Public Records
Map
Nearby Homes
- 1658 Waterview Place
- 1772 Waterview Place
- 957 Jacqueline Place
- 931 Jacqueline Place
- 1835 Northwood Rd
- 1849 Eucalyptus Rd
- 1804 Tomas Ct
- 1788 Louise Ln
- 1147 Contessa Way Unit 4
- 1525 Via Vista
- 1175 Danielle Ct
- 1658 Eucalyptus Rd
- 867 Trail View Place
- 808 Albert Way
- 708 Albert Way
- 1024 Maggie Ln
- 1590 Eucalyptus Rd
- 1035 Gavin Ln
- 1071 Ford Dr
- 1155 Aj Ln
- 969 Allison Ct
- 1691 Waterview Place
- 973 Allison Ct
- 1694 Waterview Place
- 964 Allison Ct
- 1688 Waterview Place
- 968 Allison Ct
- 964 Michele Ct
- 968 Michele Ct
- 977 Allison Ct
- 972 Allison Ct
- 1706 Waterview Place
- 976 Allison Ct
- 1711 Waterview Place
- 972 Michele Ct
- 981 Allison Ct
- 1712 Water Place
- 1712 Waterview Place
- 1676 Waterview Place
Your Personal Tour Guide
Ask me questions while you tour the home.