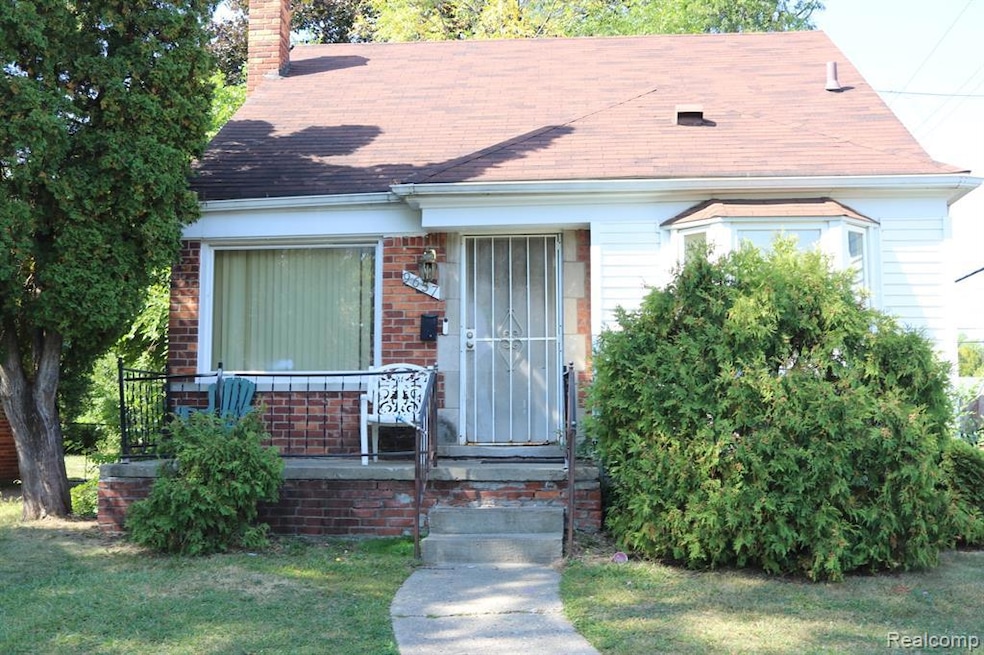
9657 Warwick St Detroit, MI 48228
Franklin Park NeighborhoodEstimated payment $420/month
Highlights
- No HOA
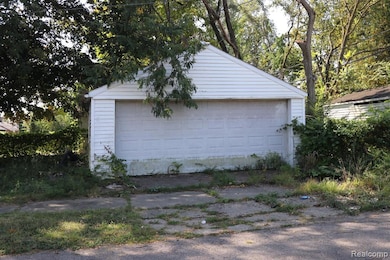
- 2 Car Detached Garage
- Forced Air Heating System
- Cass Technical High School Rated 10
- Bungalow
About This Home
Excellent opportunity to obtain a very solid investment property in Detroit currently receiving monthly DHS payments. Serious inquiries only. Current DHS payment is $1000/mth.
Home Details
Home Type
- Single Family
Year Built
- Built in 1948
Lot Details
- 6,534 Sq Ft Lot
- Lot Dimensions are 45x134.96
Parking
- 2 Car Detached Garage
Home Design
- Bungalow
- Brick Exterior Construction
- Block Foundation
Interior Spaces
- 1,023 Sq Ft Home
- 1.5-Story Property
- Unfinished Basement
Bedrooms and Bathrooms
- 3 Bedrooms
- 1 Full Bathroom
Location
- Ground Level
Utilities
- Forced Air Heating System
- Heating System Uses Natural Gas
- Sewer in Street
Community Details
- No Home Owners Association
- Palmer Grove Park 1 Subdivision
Listing and Financial Details
- Assessor Parcel Number W22I086551S
Map
Home Values in the Area
Average Home Value in this Area
Tax History
| Year | Tax Paid | Tax Assessment Tax Assessment Total Assessment is a certain percentage of the fair market value that is determined by local assessors to be the total taxable value of land and additions on the property. | Land | Improvement |
|---|---|---|---|---|
| 2025 | $1,241 | $39,000 | $0 | $0 |
| 2024 | $1,241 | $32,500 | $0 | $0 |
| 2023 | $1,205 | $26,100 | $0 | $0 |
| 2022 | $1,283 | $20,700 | $0 | $0 |
| 2021 | $1,249 | $17,300 | $0 | $0 |
| 2020 | $1,326 | $14,700 | $0 | $0 |
| 2019 | $1,229 | $13,300 | $0 | $0 |
| 2018 | $1,081 | $12,900 | $0 | $0 |
| 2017 | $203 | $12,500 | $0 | $0 |
| 2016 | $1,183 | $12,500 | $0 | $0 |
| 2015 | $1,250 | $12,500 | $0 | $0 |
| 2013 | $1,753 | $17,532 | $0 | $0 |
| 2010 | -- | $25,120 | $1,188 | $23,932 |
Property History
| Date | Event | Price | List to Sale | Price per Sq Ft |
|---|---|---|---|---|
| 09/22/2025 09/22/25 | For Sale | $60,500 | -- | $59 / Sq Ft |
Purchase History
| Date | Type | Sale Price | Title Company |
|---|---|---|---|
| Interfamily Deed Transfer | -- | None Available | |
| Interfamily Deed Transfer | -- | None Available | |
| Deed | $14,002 | None Available | |
| Warranty Deed | -- | None Available | |
| Sheriffs Deed | $99,007 | None Available | |
| Warranty Deed | $99,000 | Progressive Title Insurance | |
| Deed | $79,500 | -- | |
| Deed | $25,500 | -- |
Source: Realcomp
MLS Number: 20251030592
APN: 22-086551
Disclaimer: Certain information contained herein is derived from information provided by parties other than Homes.com. All information provided is deemed reliable, but is not guaranteed to be accurate and should be independently verified.
![]() IDX provided courtesy of Realcomp II Ltd. via Ten-X and MLS
IDX provided courtesy of Realcomp II Ltd. via Ten-X and MLS
Copyright 2025 Realcomp II Ltd. Shareholders
IDX information is provided exclusively for consumers' personal, noncommercial use and may not be used for any purpose other than to identify prospective properties consumers may be interested in purchasing. The accuracy of all information, regardless of source, is not guaranteed or warranted. All information should be independently verified.
Listing Information presented by local MLS brokerage: Ten-X, local REALTOR®- Arlene Richardson - (888)-952-6393
- 9608 Piedmont St
- 9934 Warwick St
- 9900 Grandville Ave
- 9976 Warwick St
- 9584 Artesian St
- 9583 Stahelin Ave
- 9959 Stahelin Ave
- 9570 Westwood St
- 18918 W Chicago St
- 9528 Westwood St
- 11320 Grandville Ave
- 9521 Brace St Unit 18
- 9608 Minock St
- 11320 Artesian St
- 9357 Piedmont St
- 9536 Minock St
- 10006 Minock St
- 9639 Minock St
- 10006 Auburn St
- 9637 Auburn St
- 18701 Fitzpatrick St
- 19449 W Chicago St
- 18450 W Chicago St
- 9961 Vaughan St
- 9046 Stahelin Ave
- 11315 Vaughan St
- 8900 Artesian St
- 9255 Heyden St
- 8841 Auburn St
- 9327 Fielding St
- 18401 Joy Rd Unit 8
- 11652 Fielding St
- 20611 W Chicago St
- 8442 Auburn St
- 9611 Grandmont Ave
- 8257 Minock St
- 8908 Burt Rd
- 12635 Memorial St
- 13514 Stahelin Rd
- 13500 Penrod St
