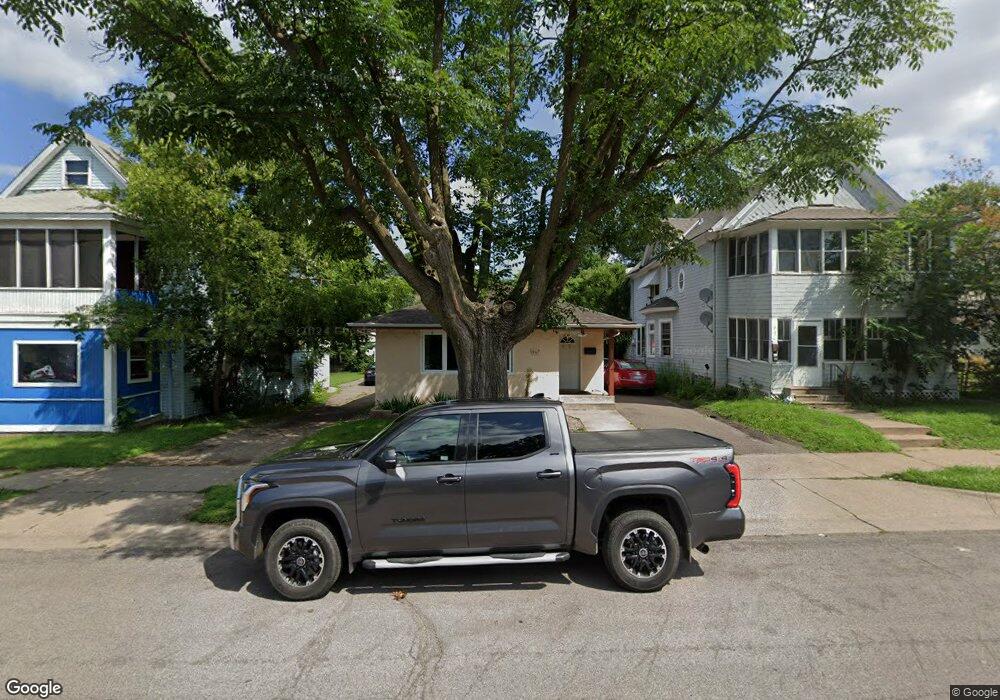
967 Case Ave Saint Paul, MN 55106
Payne-Phalen NeighborhoodEstimated Value: $234,000 - $243,000
3
Beds
1
Bath
1,114
Sq Ft
$215/Sq Ft
Est. Value
About This Home
This home is located at 967 Case Ave, Saint Paul, MN 55106 and is currently estimated at $239,669, approximately $215 per square foot. 967 Case Ave is a home located in Ramsey County with nearby schools including Frost Lake Elementary School, Txuj Ci HMong Language and Culture Upper Campus, and Johnson Senior High School.
Ownership History
Date
Name
Owned For
Owner Type
Purchase Details
Closed on
Sep 24, 2013
Sold by
Secretary Of Housing & Urban Development
Bought by
Xiong Kou and Chang Mai Yang
Current Estimated Value
Home Financials for this Owner
Home Financials are based on the most recent Mortgage that was taken out on this home.
Original Mortgage
$93,769
Outstanding Balance
$70,414
Interest Rate
4.56%
Mortgage Type
FHA
Estimated Equity
$169,255
Purchase Details
Closed on
Jan 8, 2013
Sold by
Pnc Bank National Association
Bought by
The Secretary Of Housing & Urban Develop
Create a Home Valuation Report for This Property
The Home Valuation Report is an in-depth analysis detailing your home's value as well as a comparison with similar homes in the area
Home Values in the Area
Average Home Value in this Area
Purchase History
| Date | Buyer | Sale Price | Title Company |
|---|---|---|---|
| Xiong Kou | -- | None Available | |
| The Secretary Of Housing & Urban Develop | -- | None Available |
Source: Public Records
Mortgage History
| Date | Status | Borrower | Loan Amount |
|---|---|---|---|
| Open | Xiong Kou | $93,769 |
Source: Public Records
Tax History Compared to Growth
Tax History
| Year | Tax Paid | Tax Assessment Tax Assessment Total Assessment is a certain percentage of the fair market value that is determined by local assessors to be the total taxable value of land and additions on the property. | Land | Improvement |
|---|---|---|---|---|
| 2025 | $3,160 | $231,000 | $25,000 | $206,000 |
| 2023 | $3,160 | $214,800 | $20,000 | $194,800 |
| 2022 | $2,798 | $214,300 | $20,000 | $194,300 |
| 2021 | $2,268 | $187,600 | $20,000 | $167,600 |
| 2020 | $2,242 | $161,700 | $7,000 | $154,700 |
| 2019 | $1,784 | $151,200 | $7,000 | $144,200 |
| 2018 | $1,432 | $124,100 | $7,000 | $117,100 |
| 2017 | $1,066 | $107,900 | $7,000 | $100,900 |
| 2016 | $1,612 | $0 | $0 | $0 |
| 2015 | $1,546 | $94,600 | $7,000 | $87,600 |
| 2014 | $1,212 | $0 | $0 | $0 |
Source: Public Records
Map
Nearby Homes