Estimated Value: $421,000 - $495,000
3
Beds
3
Baths
2,122
Sq Ft
$220/Sq Ft
Est. Value
About This Home
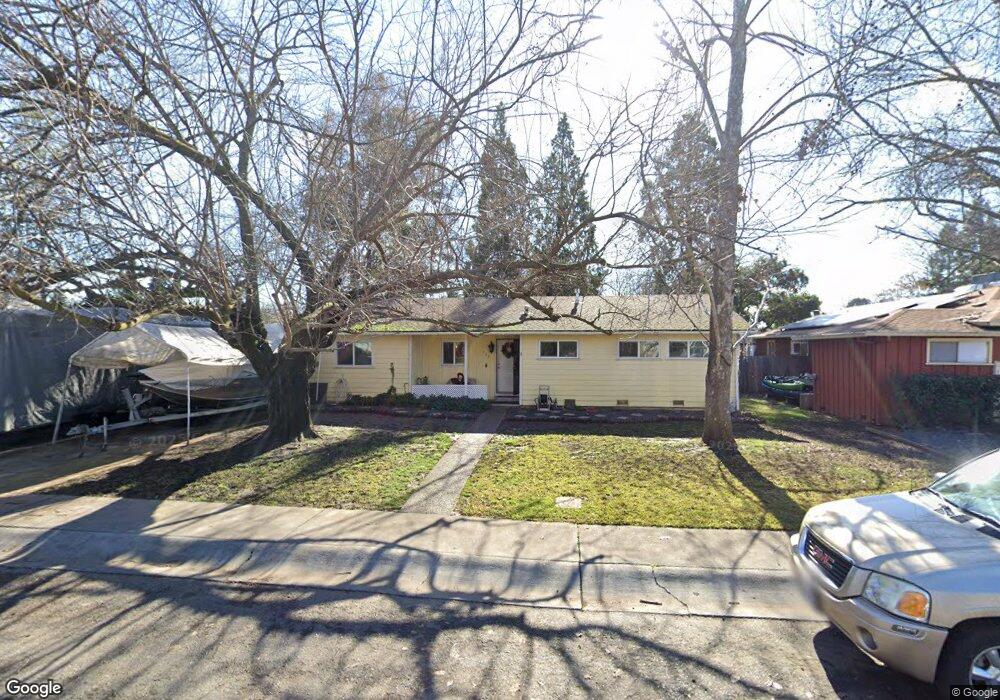
This home is located at 967 Marjorie Ave, Chico, CA 95926 and is currently estimated at $466,739, approximately $219 per square foot. 967 Marjorie Ave is a home located in Butte County with nearby schools including McManus (John A.) Elementary School, Bidwell Junior High School, and Pleasant Valley High School.
Ownership History
Date
Name
Owned For
Owner Type
Purchase Details
Closed on
Feb 9, 2010
Sold by
Wirt John and Wirt Sherry
Bought by
Terrano Paul D
Current Estimated Value
Home Financials for this Owner
Home Financials are based on the most recent Mortgage that was taken out on this home.
Original Mortgage
$190,000
Outstanding Balance
$126,250
Interest Rate
5.11%
Mortgage Type
New Conventional
Estimated Equity
$340,489
Purchase Details
Closed on
Nov 5, 2004
Sold by
Terrano Molly
Bought by
Terrano Molly L and Terrano 2004 Trust
Purchase Details
Closed on
Sep 13, 2002
Sold by
Penman Daniel F and Penman Sally Kae
Bought by
Mcphee Wirt Betty J
Home Financials for this Owner
Home Financials are based on the most recent Mortgage that was taken out on this home.
Original Mortgage
$180,000
Interest Rate
6.24%
Create a Home Valuation Report for This Property
The Home Valuation Report is an in-depth analysis detailing your home's value as well as a comparison with similar homes in the area
Purchase History
| Date | Buyer | Sale Price | Title Company |
|---|---|---|---|
| Terrano Paul D | $237,500 | Mid Valley Title & Escrow Co | |
| Terrano Molly L | -- | -- | |
| Terrano Molly | -- | -- | |
| Mcphee Wirt Betty J | $200,000 | Mid Valley Title & Escrow Co |
Source: Public Records
Mortgage History
| Date | Status | Borrower | Loan Amount |
|---|---|---|---|
| Open | Terrano Paul D | $190,000 | |
| Previous Owner | Mcphee Wirt Betty J | $180,000 |
Source: Public Records
Tax History
| Year | Tax Paid | Tax Assessment Tax Assessment Total Assessment is a certain percentage of the fair market value that is determined by local assessors to be the total taxable value of land and additions on the property. | Land | Improvement |
|---|---|---|---|---|
| 2025 | $3,068 | $289,641 | $112,959 | $176,682 |
| 2024 | $3,068 | $283,963 | $110,745 | $173,218 |
| 2023 | $3,030 | $278,396 | $108,574 | $169,822 |
| 2022 | $2,980 | $272,939 | $106,446 | $166,493 |
| 2021 | $2,922 | $267,588 | $104,359 | $163,229 |
| 2020 | $2,913 | $264,845 | $103,289 | $161,556 |
| 2019 | $2,859 | $259,653 | $101,264 | $158,389 |
| 2018 | $2,805 | $254,563 | $99,279 | $155,284 |
| 2017 | $2,746 | $249,573 | $97,333 | $152,240 |
| 2016 | $2,505 | $244,680 | $95,425 | $149,255 |
| 2015 | $2,504 | $241,006 | $93,992 | $147,014 |
| 2014 | $2,455 | $236,286 | $92,151 | $144,135 |
Source: Public Records
Map
Nearby Homes
- 75 Cottage Ave
- 9 Trieste Way
- 2165 Ceres Ave
- 30 Plaza Way Unit 6
- 30 Plaza Way Unit 7
- 1094 Manzanita Ave
- 50 Casa Del Rey Ct
- 599 East Ave
- 598 El Reno Dr
- 460 E 10th Ave
- 16 El Cerrito Dr
- 1612 Neal Dow Ave
- 559 East Ave
- 5 Glenshire Ln
- 34 Garden Park Dr
- 467 E 8th Ave
- 38 Lobelia Ct
- 1261 Parque Dr
- 3001 Ashburton Ln
- 5 Canterbury Cir