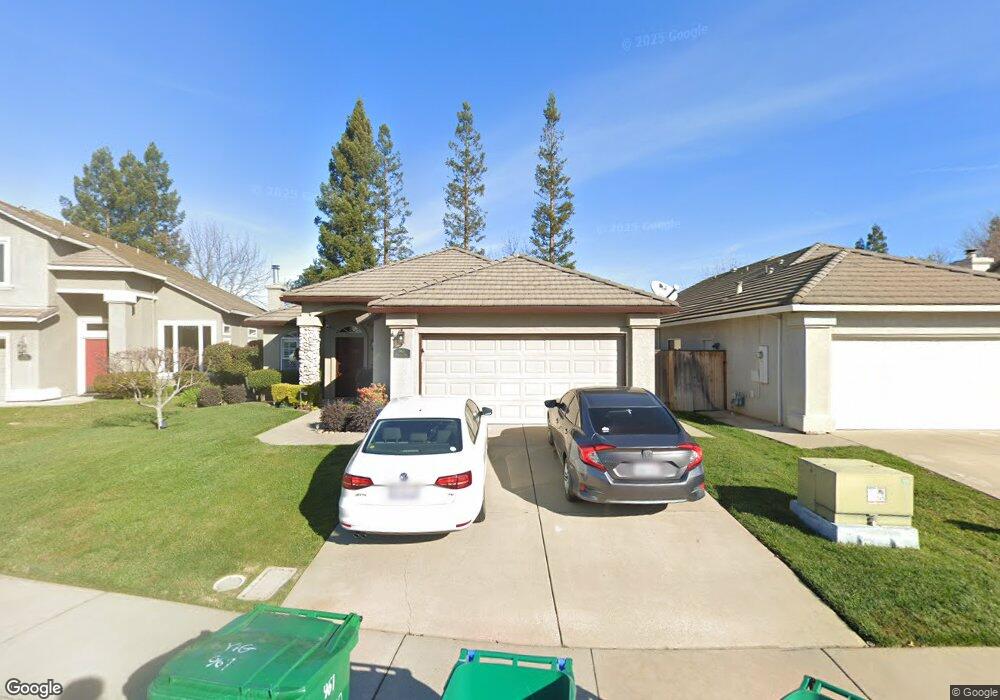
967 Pearwood Cir Lodi, CA 95242
Sunwest NeighborhoodEstimated Value: $398,000 - $586,000
4
Beds
2
Baths
1,748
Sq Ft
$304/Sq Ft
Est. Value
About This Home
This home is located at 967 Pearwood Cir, Lodi, CA 95242 and is currently estimated at $532,018, approximately $304 per square foot. 967 Pearwood Cir is a home located in San Joaquin County with nearby schools including Erma B. Reese Elementary School, Millswood Middle School, and Lodi High School.
Ownership History
Date
Name
Owned For
Owner Type
Purchase Details
Closed on
Jan 27, 2010
Sold by
Staal Tara Warner and Staal James
Bought by
Tougas Jon Michael and Tougas Kari Lea
Current Estimated Value
Home Financials for this Owner
Home Financials are based on the most recent Mortgage that was taken out on this home.
Original Mortgage
$280,819
Outstanding Balance
$184,361
Interest Rate
4.87%
Mortgage Type
FHA
Estimated Equity
$347,657
Purchase Details
Closed on
Sep 15, 2004
Sold by
Vernon John E and Vernon Julie
Bought by
Staal James and Staal Tara Warner
Home Financials for this Owner
Home Financials are based on the most recent Mortgage that was taken out on this home.
Original Mortgage
$303,200
Interest Rate
5.5%
Mortgage Type
Purchase Money Mortgage
Purchase Details
Closed on
Feb 22, 2000
Sold by
Towne Ranch Associates Ltd Ptp
Bought by
Vernon John E and Vernon Julie
Home Financials for this Owner
Home Financials are based on the most recent Mortgage that was taken out on this home.
Original Mortgage
$177,760
Interest Rate
8.16%
Mortgage Type
FHA
Create a Home Valuation Report for This Property
The Home Valuation Report is an in-depth analysis detailing your home's value as well as a comparison with similar homes in the area
Home Values in the Area
Average Home Value in this Area
Purchase History
| Date | Buyer | Sale Price | Title Company |
|---|---|---|---|
| Tougas Jon Michael | $286,000 | Old Republic Title Company | |
| Staal James | $379,000 | Fidelity Natl Title Ins Co | |
| Vernon John E | $179,000 | Chicago Title Co |
Source: Public Records
Mortgage History
| Date | Status | Borrower | Loan Amount |
|---|---|---|---|
| Open | Tougas Jon Michael | $280,819 | |
| Previous Owner | Staal James | $303,200 | |
| Previous Owner | Vernon John E | $177,760 |
Source: Public Records
Tax History Compared to Growth
Tax History
| Year | Tax Paid | Tax Assessment Tax Assessment Total Assessment is a certain percentage of the fair market value that is determined by local assessors to be the total taxable value of land and additions on the property. | Land | Improvement |
|---|---|---|---|---|
| 2025 | $4,005 | $369,156 | $91,642 | $277,514 |
| 2024 | $3,895 | $361,919 | $89,846 | $272,073 |
| 2023 | $3,850 | $354,824 | $88,085 | $266,739 |
| 2022 | $3,765 | $347,867 | $86,358 | $261,509 |
| 2021 | $3,833 | $341,047 | $84,665 | $256,382 |
| 2020 | $3,733 | $337,551 | $83,797 | $253,754 |
| 2019 | $3,658 | $330,933 | $82,154 | $248,779 |
| 2018 | $3,607 | $324,445 | $80,544 | $243,901 |
| 2017 | $3,527 | $318,084 | $78,965 | $239,119 |
| 2016 | $3,306 | $311,849 | $77,417 | $234,432 |
| 2014 | $3,227 | $301,153 | $74,762 | $226,391 |
Source: Public Records
Map
Nearby Homes
- 1111 Brighton Way
- 2937 Heritage Oak Way
- 991 Harvest Crossing St
- 2662 Veneto Ct
- 2670 Manza Ct
- 2400 Eilers Ln Unit 1703
- 2400 Eilers Ln Unit 1906
- 2400 Eilers Ln Unit 1607
- 450 W Turner Rd
- 2401 Eilers Ln Unit 1003
- 2401 Eilers Ln Unit 304
- 2408 Tejon St
- 2355 Woodlake Cir
- 324 Applewood Dr
- 2439 Inglewood Dr
- 2526 Park Dr W
- 641 Rutledge Dr
- 493 Carolina St
- 406 Whitney St
- 2300 Eilers Ln
- 963 Pearwood Cir
- 971 Pearwood Cir
- 959 Pearwood Cir
- 979 Pearwood Cir
- 955 Pearwood Cir
- 964 Pearwood Cir
- 970 Pearwood Cir
- 960 Pearwood Cir
- 983 Pearwood Cir
- 951 Pearwood Cir
- 956 Pearwood Cir
- 987 Pearwood Cir
- 3012 Cumbria Way
- 3020 Cumbria Way
- 952 Pearwood Cir
- 991 Pearwood Cir
- 947 Pearwood Cir
- 3030 Cumbria Way
- 2863 Mosswood Dr
- 2857 Mosswood Dr