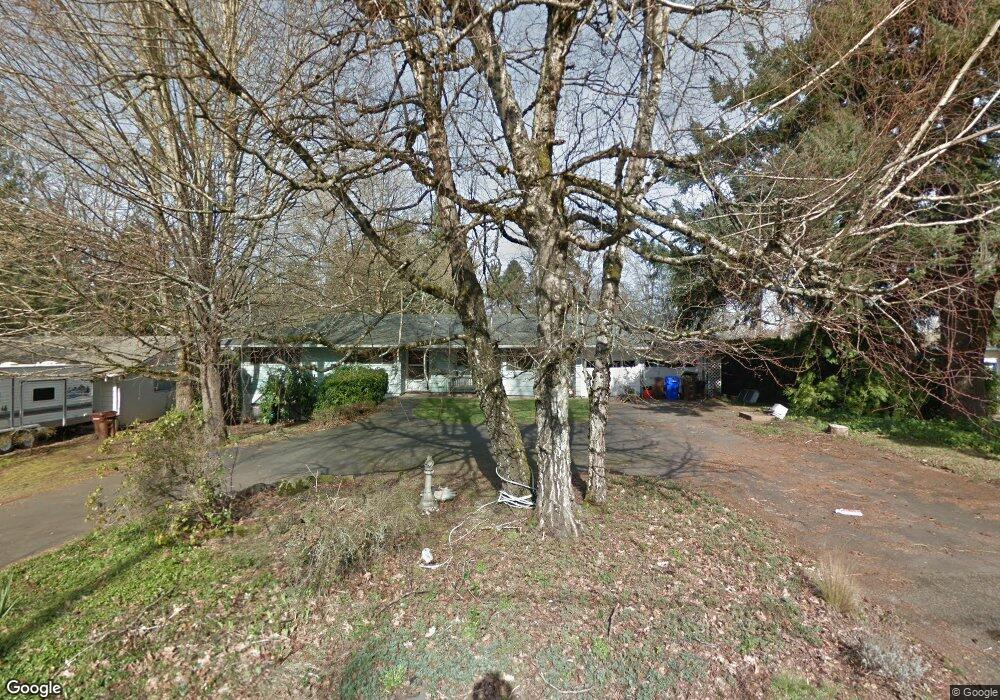
967 SE 9th St Gresham, OR 97080
Historic Southeast NeighborhoodEstimated Value: $475,000 - $638,000
5
Beds
3
Baths
2,740
Sq Ft
$214/Sq Ft
Est. Value
About This Home
This home is located at 967 SE 9th St, Gresham, OR 97080 and is currently estimated at $586,859, approximately $214 per square foot. 967 SE 9th St is a home located in Multnomah County with nearby schools including East Gresham Elementary School, Dexter McCarty Middle School, and Gresham High School.
Ownership History
Date
Name
Owned For
Owner Type
Purchase Details
Closed on
Jul 27, 2021
Sold by
Scannell Stephen G
Bought by
Scannell Stephen G and Scannell Heather W
Current Estimated Value
Purchase Details
Closed on
Aug 1, 2011
Sold by
Morgan Jeffrey P
Bought by
Scannell Stephen G
Home Financials for this Owner
Home Financials are based on the most recent Mortgage that was taken out on this home.
Original Mortgage
$261,250
Outstanding Balance
$177,347
Interest Rate
4.46%
Mortgage Type
New Conventional
Estimated Equity
$409,512
Create a Home Valuation Report for This Property
The Home Valuation Report is an in-depth analysis detailing your home's value as well as a comparison with similar homes in the area
Home Values in the Area
Average Home Value in this Area
Purchase History
| Date | Buyer | Sale Price | Title Company |
|---|---|---|---|
| Scannell Stephen G | -- | None Available | |
| Scannell Stephen G | $275,000 | First American |
Source: Public Records
Mortgage History
| Date | Status | Borrower | Loan Amount |
|---|---|---|---|
| Open | Scannell Stephen G | $261,250 |
Source: Public Records
Tax History
| Year | Tax Paid | Tax Assessment Tax Assessment Total Assessment is a certain percentage of the fair market value that is determined by local assessors to be the total taxable value of land and additions on the property. | Land | Improvement |
|---|---|---|---|---|
| 2025 | $5,602 | $275,300 | -- | -- |
| 2024 | $5,363 | $267,290 | -- | -- |
| 2023 | $4,886 | $259,510 | $0 | $0 |
| 2022 | $4,749 | $251,960 | $0 | $0 |
| 2021 | $4,630 | $244,630 | $0 | $0 |
| 2020 | $4,356 | $237,510 | $0 | $0 |
| 2019 | $4,242 | $230,600 | $0 | $0 |
| 2018 | $4,045 | $223,890 | $0 | $0 |
| 2017 | $3,881 | $217,370 | $0 | $0 |
| 2016 | $3,422 | $211,040 | $0 | $0 |
Source: Public Records
Map
Nearby Homes
- 329 SE Linden Ct
- 511 SE 15th St
- 415 SE Roberts Ave
- 1414 SE Beech Place
- 1700 SE 4th St
- 1949 SE Palmquist Rd Unit 51
- 1949 SE Palmquist Rd Unit 91
- 1949 SE Palmquist Rd Unit 121
- 450 SE Hogan Rd
- 4740 SE 2nd St
- 4764 SE 2nd St
- 4667 SE 2nd St
- 55 SW Lovhar Dr
- 1918 SE Regner Rd
- 2024 SE Spruce Ave
- 0 SW Miller Ct Unit 470855683
- 732 SE Rene Ave
- 234 NE Cleveland Ave
- 2137 SE 15th Aly
- 2358 SE Palmquist Rd
Your Personal Tour Guide
Ask me questions while you tour the home.