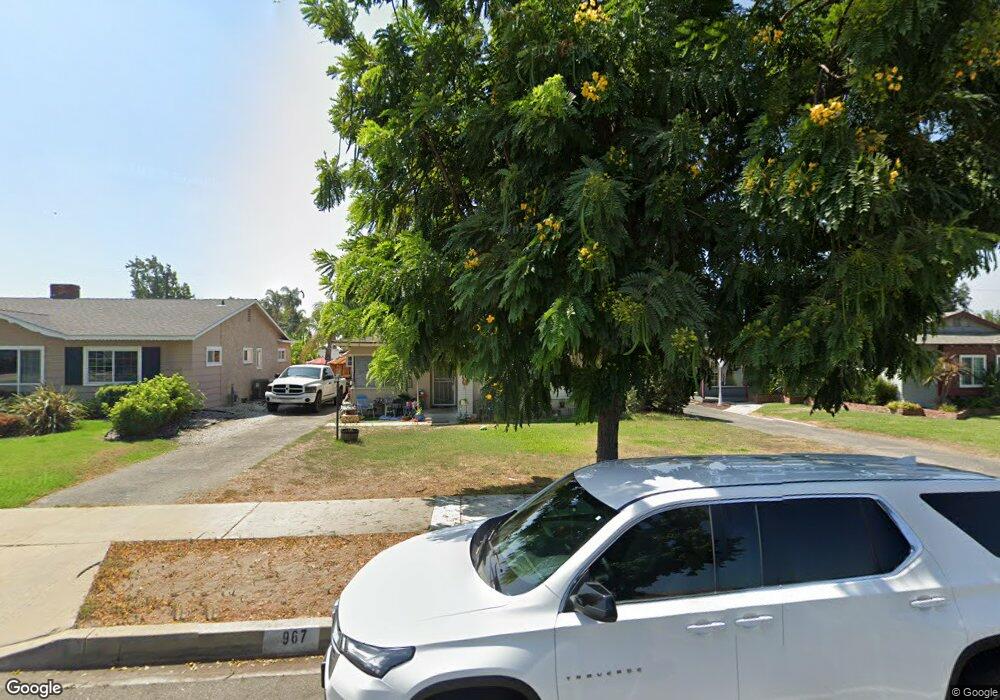
967 W 5th St Ontario, CA 91762
Downtown Ontario NeighborhoodEstimated Value: $595,986 - $717,000
2
Beds
2
Baths
1,198
Sq Ft
$546/Sq Ft
Est. Value
About This Home
This home is located at 967 W 5th St, Ontario, CA 91762 and is currently estimated at $653,997, approximately $545 per square foot. 967 W 5th St is a home located in San Bernardino County with nearby schools including Hawthorne Elementary, Vina Danks Middle, and Chaffey High School.
Ownership History
Date
Name
Owned For
Owner Type
Purchase Details
Closed on
Sep 30, 2011
Sold by
Correggia Marie Elaine
Bought by
Correggia Brent Alan and Correggia Linda Kay
Current Estimated Value
Purchase Details
Closed on
Sep 23, 2011
Sold by
Correggia Marie Elaine
Bought by
Correggia Brent Alan and Correggia Linda Kay
Purchase Details
Closed on
Sep 22, 2011
Sold by
Correggia Marie Elaine
Bought by
Correggia Brent Alan and Correggia Linda Kay
Purchase Details
Closed on
Sep 15, 2011
Sold by
Correggia Marie Elaine
Bought by
Correggia Brent Alan and Correggia Linda Kay
Purchase Details
Closed on
Sep 14, 2011
Sold by
Correggia Marie Elaine
Bought by
Correggia Brent Alan and Correggia Linda Kay
Purchase Details
Closed on
Sep 19, 1995
Sold by
Correggia David
Bought by
Correggia David and Correggia Marie
Purchase Details
Closed on
May 23, 1995
Sold by
Correggia David
Bought by
Correggia David and Correggia Marie E
Create a Home Valuation Report for This Property
The Home Valuation Report is an in-depth analysis detailing your home's value as well as a comparison with similar homes in the area
Home Values in the Area
Average Home Value in this Area
Purchase History
| Date | Buyer | Sale Price | Title Company |
|---|---|---|---|
| Correggia Brent Alan | -- | None Available | |
| Correggia Brent Alan | -- | None Available | |
| Correggia Brent Alan | -- | None Available | |
| Correggia Brent Alan | -- | None Available | |
| Correggia Brent Alan | -- | None Available | |
| Correggia Marie Elaine | -- | None Available | |
| Correggia David | -- | -- | |
| Correggia David | -- | -- |
Source: Public Records
Tax History Compared to Growth
Tax History
| Year | Tax Paid | Tax Assessment Tax Assessment Total Assessment is a certain percentage of the fair market value that is determined by local assessors to be the total taxable value of land and additions on the property. | Land | Improvement |
|---|---|---|---|---|
| 2025 | $715 | $64,634 | $13,165 | $51,469 |
| 2024 | $715 | $63,367 | $12,907 | $50,460 |
| 2023 | $695 | $62,125 | $12,654 | $49,471 |
| 2022 | $685 | $60,907 | $12,406 | $48,501 |
| 2021 | $681 | $59,713 | $12,163 | $47,550 |
| 2020 | $669 | $59,100 | $12,038 | $47,062 |
| 2019 | $664 | $57,941 | $11,802 | $46,139 |
| 2018 | $654 | $56,805 | $11,571 | $45,234 |
| 2017 | $631 | $55,691 | $11,344 | $44,347 |
| 2016 | $607 | $54,599 | $11,122 | $43,477 |
| 2015 | $603 | $53,779 | $10,955 | $42,824 |
| 2014 | $584 | $52,725 | $10,740 | $41,985 |
Source: Public Records
Map
Nearby Homes
- 945 W Bonnie Brae Ct
- 1163 W Princeton St
- 822 W 4th St
- 1111 W J St
- 1456 N Elderberry Ave
- 1105 W Berkeley Ct
- 1353 W Princeton St
- Plan 3 at Canopy
- Plan 4 at Canopy
- 1324 W Oakcrest Paseo
- 1326 W Oakcrest Paseo
- 1164 W I St
- 1415 W Harvard Place
- 1557 N Beverly Ct
- 631 W Berkeley Ct
- 1549 N Oaks Ct
- 1352 W Granada Ct
- 321 Spencer Ave
- 1453 W 7th St Unit 24
- 1428 Fredericks Ln