Estimated Value: $567,431 - $678,000
5
Beds
4
Baths
3,457
Sq Ft
$175/Sq Ft
Est. Value
About This Home
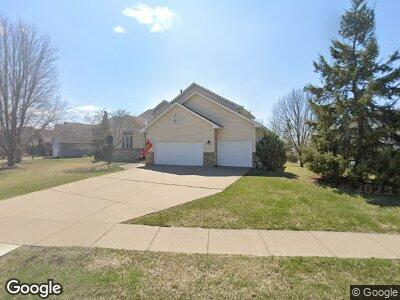
This home is located at 9675 Winslow Chase, Osseo, MN 55311 and is currently estimated at $604,358, approximately $174 per square foot. 9675 Winslow Chase is a home located in Hennepin County with nearby schools including Rush Creek Elementary School, Maple Grove Middle School, and Maple Grove Senior High School.
Ownership History
Date
Name
Owned For
Owner Type
Purchase Details
Closed on
Apr 29, 2022
Sold by
Tansey Patrick and Tansey Charlene
Bought by
Grim Christopher and Grim Mickaela
Current Estimated Value
Home Financials for this Owner
Home Financials are based on the most recent Mortgage that was taken out on this home.
Original Mortgage
$514,400
Outstanding Balance
$487,647
Interest Rate
4.16%
Mortgage Type
New Conventional
Estimated Equity
$116,711
Purchase Details
Closed on
Apr 25, 2022
Sold by
Tansey Patrick J and Tansey Charlene A
Bought by
Grim Christopher and Grim Mickaela
Home Financials for this Owner
Home Financials are based on the most recent Mortgage that was taken out on this home.
Original Mortgage
$514,400
Outstanding Balance
$487,647
Interest Rate
4.16%
Mortgage Type
New Conventional
Estimated Equity
$116,711
Purchase Details
Closed on
Feb 22, 2000
Sold by
Residential Funding Corp
Bought by
Tansey Patrick J and Tansey Charlene A
Purchase Details
Closed on
Sep 13, 1999
Sold by
Chase Manhattan Mtg Corp
Bought by
Residential Funding Corp
Create a Home Valuation Report for This Property
The Home Valuation Report is an in-depth analysis detailing your home's value as well as a comparison with similar homes in the area
Home Values in the Area
Average Home Value in this Area
Purchase History
| Date | Buyer | Sale Price | Title Company |
|---|---|---|---|
| Grim Christopher | $560,000 | -- | |
| Grim Christopher | $560,000 | Edina Realty Title | |
| Tansey Patrick J | $219,900 | -- | |
| Residential Funding Corp | $199,700 | -- |
Source: Public Records
Mortgage History
| Date | Status | Borrower | Loan Amount |
|---|---|---|---|
| Open | Grim Christopher | $514,400 | |
| Closed | Grim Christopher | $514,400 | |
| Previous Owner | Tansey Patrick J | $228,600 |
Source: Public Records
Tax History Compared to Growth
Tax History
| Year | Tax Paid | Tax Assessment Tax Assessment Total Assessment is a certain percentage of the fair market value that is determined by local assessors to be the total taxable value of land and additions on the property. | Land | Improvement |
|---|---|---|---|---|
| 2023 | $6,825 | $540,500 | $152,000 | $388,500 |
| 2022 | $5,345 | $487,800 | $90,200 | $397,600 |
| 2021 | $5,289 | $408,500 | $71,400 | $337,100 |
| 2020 | $5,481 | $397,900 | $69,900 | $328,000 |
| 2019 | $5,111 | $393,000 | $79,900 | $313,100 |
| 2018 | $5,075 | $374,000 | $78,900 | $295,100 |
| 2017 | $5,070 | $350,800 | $79,000 | $271,800 |
| 2016 | $5,009 | $342,400 | $79,000 | $263,400 |
| 2015 | $5,194 | $345,100 | $89,000 | $256,100 |
| 2014 | -- | $320,100 | $89,000 | $231,100 |
Source: Public Records
Map
Nearby Homes
- 9694 Winslow Chase N
- 18602 97th Place N
- 18869 97th Place N
- 18690 97th Place N
- 9567 Alvarado Ln N
- 18534 98th Place N
- 18061 96th Ave N
- 18049 96th Ave N
- 9885 Troy Ln N
- 9934 Walnut Grove Ln N
- 9640 Peony Ln N Unit 1208
- 9179 Larkspur Glade
- 19029 100th Place N
- 19086 100th Place N
- 19253 99th Place
- 9670 Merrimac Ln N
- 19101 101st Place
- 19510 103rd Ave
- 19077 101st Place
- 17606 93rd Place N
- 9675 Winslow Chase
- 9667 Winslow Chase
- 9683 Winslow Chase
- 9659 Winslow Chase
- 9678 Winslow Chase
- 9694 Winslow Chase
- 9682 Winslow Chase
- 9668 Winslow Chase
- 9656 Winslow Chase
- 9674 Winslow Chase
- 9656 Winslow Chase N
- 9651 Winslow Chase
- 18566 96th Place N
- 18534 96th Place N
- 18579 96th Place N
- 9612 Zircon Ln N
- 18512 96th Place N
- 9618 Zircon Ln N
- 9604 Zircon Ln N
- 9626 Zircon Ln N