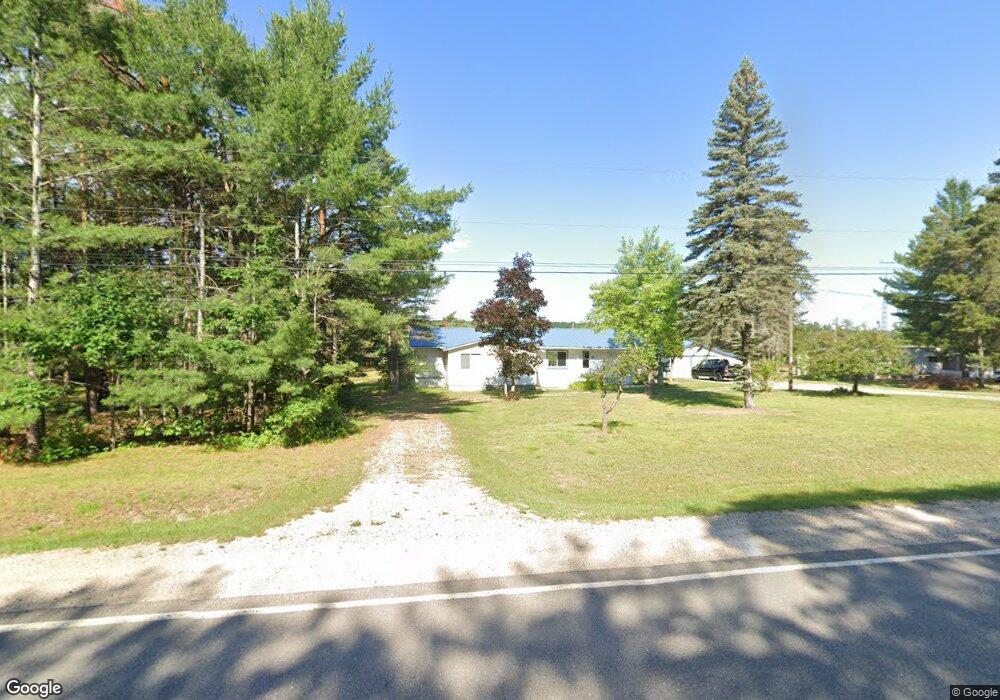
9679 Twin Bridge Rd Grayling, MI 49738
Estimated Value: $65,160 - $195,000
Studio
--
Bath
915
Sq Ft
$163/Sq Ft
Est. Value
About This Home
This home is located at 9679 Twin Bridge Rd, Grayling, MI 49738 and is currently estimated at $148,790, approximately $162 per square foot. 9679 Twin Bridge Rd is a home located in Crawford County with nearby schools including Grayling Elementary School, Grayling Middle School, and Grayling High School.
Ownership History
Date
Name
Owned For
Owner Type
Purchase Details
Closed on
Feb 24, 2017
Sold by
Bush Mark Brian
Bought by
Mclean John E
Current Estimated Value
Purchase Details
Closed on
Mar 12, 2012
Sold by
Combs Kevin and Coulter Edward J
Bought by
Combs Kevin and Verdier Penny Lynn
Purchase Details
Closed on
Mar 9, 2012
Sold by
Verdier Penny Lynn
Bought by
Combs Kevin
Purchase Details
Closed on
Aug 21, 2010
Sold by
Edward J Coulter
Purchase Details
Closed on
Aug 24, 2004
Sold by
Williams Kay
Bought by
Willams Kay and Coulter Edward J
Purchase Details
Closed on
Jun 25, 2004
Sold by
Darlene Richard and Darlene Coulter
Bought by
Coulter Richard and Coulter Darlene
Purchase Details
Closed on
May 6, 2004
Sold by
Williams K Coulter Richard and Williams K Darl
Bought by
Williams K Coulter Richard and Edwar Williams K
Purchase Details
Closed on
Jan 16, 2004
Sold by
Edward Coulter
Bought by
Williams Kay and Richard Coulter
Purchase Details
Closed on
Oct 19, 1987
Sold by
Anna Coulter
Bought by
Edward Coulter
Create a Home Valuation Report for This Property
The Home Valuation Report is an in-depth analysis detailing your home's value as well as a comparison with similar homes in the area
Purchase History
| Date | Buyer | Sale Price | Title Company |
|---|---|---|---|
| Mclean John E | $17,500 | None Available | |
| Combs Kevin | -- | -- | |
| Combs Kevin | -- | -- | |
| -- | -- | -- | |
| Willams Kay | -- | -- | |
| Coulter Richard | -- | -- | |
| Williams K Coulter Richard | -- | -- | |
| Williams Kay | -- | -- | |
| Edward Coulter | -- | -- |
Source: Public Records
Tax History
| Year | Tax Paid | Tax Assessment Tax Assessment Total Assessment is a certain percentage of the fair market value that is determined by local assessors to be the total taxable value of land and additions on the property. | Land | Improvement |
|---|---|---|---|---|
| 2025 | $736 | $29,600 | $1,500 | $28,100 |
| 2024 | $722 | $28,700 | $1,500 | $27,200 |
| 2023 | $92 | $20,700 | $1,500 | $19,200 |
| 2022 | $0 | $15,300 | $1,500 | $13,800 |
| 2021 | $82 | $11,000 | $1,500 | $9,500 |
| 2020 | $77 | $10,300 | $1,500 | $8,800 |
| 2019 | $256 | $9,700 | $1,500 | $8,200 |
| 2018 | $345 | $10,400 | $1,500 | $8,900 |
| 2017 | $208 | $10,900 | $1,500 | $9,400 |
| 2016 | $300 | $15,800 | $1,500 | $14,300 |
| 2015 | -- | $15,800 | $0 | $0 |
| 2014 | -- | $15,500 | $0 | $0 |
| 2013 | -- | $15,700 | $0 | $0 |
Source: Public Records
Map
Nearby Homes
- 7727 Bald Hill Rd
- 11858 Crapo Lake Rd
- 80 Lovells Rd
- 0 Lovells Rd Unit 1933430
- 11551 Enchanted Dr
- 11800 Goodfellow Dr
- 11643 Huntingdon Dr
- Lot 297 Nottingham Dr
- 1161 Lagoon St
- Lot 222 Fascination Dr
- 2845 Oak Ave
- 11468 Sherwood Dr
- 11456 Sherwood Dr
- Parcel 1 Thunder Mug Rd
- 3123 Lovells Rd
- 00 E North Down River Rd
- 3290 Skyline Rd
- 0000 E North Down River Rd
- 126 Long Dr
- 2832 Creekview Dr
- 9701 Twin Bridge Rd
- 9641 Twin Bridge Rd
- 9717 Twin Bridge Rd
- 9611 Twin Bridge Rd
- 9605 Twin Bridge Rd
- 9737 Twin Bridge Rd
- 9774 Cook Trail
- 9792 Cook
- 5696 Fum Trail
- 9848 Cook Trail
- 5608 Fum Trail
- 9830 Cook Trail
- 9331 Twin Bridge Rd
- 9892 Twin Bridge Rd
- 9427 Twin Bridge Rd
- 9950 Ski Hill Rd
- 9921 Twin Bridge Rd
- 9921 Twin Bridge Rd
- 5715 Willow Banks Rd
- 5520 Fum Trail
Your Personal Tour Guide
Ask me questions while you tour the home.