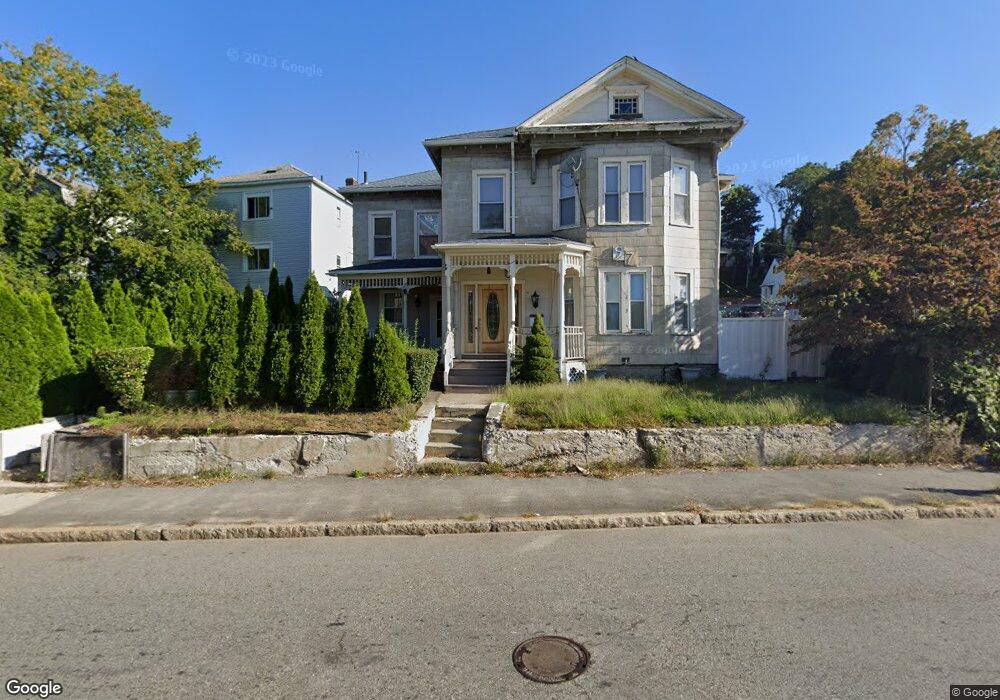
97 Cambridge St Worcester, MA 01603
University Park NeighborhoodEstimated Value: $441,609 - $649,000
6
Beds
2
Baths
2,640
Sq Ft
$214/Sq Ft
Est. Value
About This Home
This home is located at 97 Cambridge St, Worcester, MA 01603 and is currently estimated at $564,902, approximately $213 per square foot. 97 Cambridge St is a home located in Worcester County with nearby schools including Goddard School of Science & Technology, Jacob Hiatt Magnet School, and Chandler Magnet.
Ownership History
Date
Name
Owned For
Owner Type
Purchase Details
Closed on
Jan 18, 2000
Sold by
Ward Bernadette E and Hoey Regina M
Bought by
Peguero Domingo A
Current Estimated Value
Home Financials for this Owner
Home Financials are based on the most recent Mortgage that was taken out on this home.
Original Mortgage
$58,900
Interest Rate
7.79%
Mortgage Type
Purchase Money Mortgage
Create a Home Valuation Report for This Property
The Home Valuation Report is an in-depth analysis detailing your home's value as well as a comparison with similar homes in the area
Home Values in the Area
Average Home Value in this Area
Purchase History
| Date | Buyer | Sale Price | Title Company |
|---|---|---|---|
| Peguero Domingo A | $62,000 | -- |
Source: Public Records
Mortgage History
| Date | Status | Borrower | Loan Amount |
|---|---|---|---|
| Open | Peguero Domingo A | $108,000 | |
| Closed | Peguero Domingo A | $58,900 |
Source: Public Records
Tax History Compared to Growth
Tax History
| Year | Tax Paid | Tax Assessment Tax Assessment Total Assessment is a certain percentage of the fair market value that is determined by local assessors to be the total taxable value of land and additions on the property. | Land | Improvement |
|---|---|---|---|---|
| 2025 | $4,780 | $362,400 | $87,900 | $274,500 |
| 2024 | $4,565 | $332,000 | $87,900 | $244,100 |
| 2023 | $4,260 | $297,100 | $76,500 | $220,600 |
| 2022 | $3,909 | $257,000 | $61,200 | $195,800 |
| 2021 | $3,559 | $218,600 | $48,900 | $169,700 |
| 2020 | $3,346 | $196,800 | $48,600 | $148,200 |
| 2019 | $3,328 | $184,900 | $42,400 | $142,500 |
| 2018 | $3,264 | $172,600 | $42,400 | $130,200 |
| 2017 | $3,116 | $162,100 | $42,400 | $119,700 |
| 2016 | $3,065 | $148,700 | $31,100 | $117,600 |
| 2015 | $2,984 | $148,700 | $31,100 | $117,600 |
| 2014 | $2,906 | $148,700 | $31,100 | $117,600 |
Source: Public Records
Map
Nearby Homes
- 16 Ives St
- 14 Ives St
- 17 Ives St
- 12 Ives St
- 15 Ives St
- 19 Ives St
- 11 Ives St
- 10 Ives St
- 10 Ives St Unit 1
- 21 Ives St
- 42 Hitchcock Rd
- 44 Hitchcock Rd
- 73 Cambridge St
- 8 Ives St
- 46 Hitchcock Rd
- 40 Hitchcock Rd
- 40 Hitchcock Rd Unit 2,40
- 40 Hitchcock Rd Unit A
- 40 Hitchcock Rd Unit 1
- 40 Hitchcock Rd Unit 3