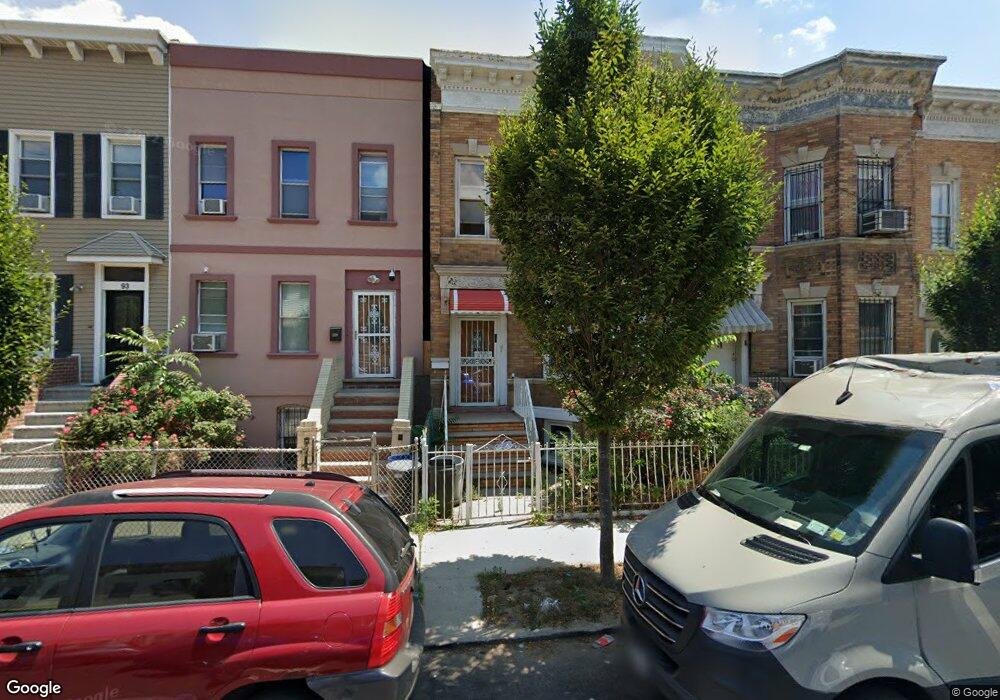
97 E 31st St Brooklyn, NY 11226
Flatbush NeighborhoodEstimated Value: $882,783 - $1,182,000
Studio
--
Bath
2,440
Sq Ft
$442/Sq Ft
Est. Value
About This Home
This home is located at 97 E 31st St, Brooklyn, NY 11226 and is currently estimated at $1,077,696, approximately $441 per square foot. 97 E 31st St is a home located in Kings County with nearby schools including P.S. 181, Middle School 246 Walt Whitman, and Central Brooklyn Ascend Charter.
Ownership History
Date
Name
Owned For
Owner Type
Purchase Details
Closed on
Jan 7, 2008
Sold by
Thomas Joan and Thomas Joel
Bought by
Jack Presuce P
Current Estimated Value
Home Financials for this Owner
Home Financials are based on the most recent Mortgage that was taken out on this home.
Original Mortgage
$482,429
Interest Rate
6.02%
Mortgage Type
Purchase Money Mortgage
Purchase Details
Closed on
Jul 28, 2006
Sold by
Noel Anthony
Bought by
Thomas Joan and Thomas Joel
Purchase Details
Closed on
Mar 27, 2006
Sold by
Hudson Etheline
Bought by
Noel Anthony
Home Financials for this Owner
Home Financials are based on the most recent Mortgage that was taken out on this home.
Original Mortgage
$106,400
Interest Rate
6.26%
Purchase Details
Closed on
Feb 14, 1995
Sold by
West Livingston
Bought by
Hudson Etheline
Create a Home Valuation Report for This Property
The Home Valuation Report is an in-depth analysis detailing your home's value as well as a comparison with similar homes in the area
Home Values in the Area
Average Home Value in this Area
Purchase History
| Date | Buyer | Sale Price | Title Company |
|---|---|---|---|
| Jack Presuce P | $490,000 | -- | |
| Jack Presuce P | $490,000 | -- | |
| Thomas Joan | -- | -- | |
| Thomas Joan | -- | -- | |
| Noel Anthony | $532,000 | -- | |
| Noel Anthony | $532,000 | -- | |
| Hudson Etheline | -- | First American Title Ins Co | |
| Hudson Etheline | -- | First American Title Ins Co |
Source: Public Records
Mortgage History
| Date | Status | Borrower | Loan Amount |
|---|---|---|---|
| Previous Owner | Jack Presuce P | $482,429 | |
| Previous Owner | Noel Anthony | $106,400 | |
| Previous Owner | Noel Anthony | $425,600 |
Source: Public Records
Tax History
| Year | Tax Paid | Tax Assessment Tax Assessment Total Assessment is a certain percentage of the fair market value that is determined by local assessors to be the total taxable value of land and additions on the property. | Land | Improvement |
|---|---|---|---|---|
| 2025 | $7,456 | $65,580 | $20,040 | $45,540 |
| 2024 | $7,456 | $51,780 | $20,040 | $31,740 |
| 2023 | $7,113 | $48,960 | $20,040 | $28,920 |
| 2022 | $6,596 | $53,640 | $20,040 | $33,600 |
| 2021 | $6,954 | $51,000 | $20,040 | $30,960 |
| 2020 | $3,430 | $48,840 | $20,040 | $28,800 |
| 2019 | $6,472 | $48,840 | $20,040 | $28,800 |
| 2018 | $5,950 | $29,186 | $16,166 | $13,020 |
| 2017 | $5,613 | $27,536 | $17,858 | $9,678 |
| 2016 | $5,505 | $27,536 | $18,033 | $9,503 |
| 2015 | $2,913 | $27,326 | $16,693 | $10,633 |
| 2014 | $2,913 | $25,780 | $16,461 | $9,319 |
Source: Public Records
Map
Nearby Homes
- 3112 Snyder Ave
- 3104 Snyder Ave
- 1044 New York Ave
- 1515 Nostrand Ave
- 160 E 31st St
- 3400 Snyder Ave Unit 6A
- 3400 Snyder Ave Unit 3D
- 3400 Snyder Ave Unit 5S
- 3400 Snyder Ave Unit 6N
- 282 E 35th St Unit 4K
- 282 E 35th St Unit 7E
- 14 E 32nd St
- 3120 Church Ave
- 117 E 29th St Unit PH-B
- 285 E 35th St Unit 4B
- 285 E 35th St Unit 6K
- 285 E 35th St Unit 6E
- 285 E 35th St Unit 7J
- 285 E 35 St Unit 2D
- 1655 Nostrand Ave
- 97 E 31st St Unit 2nd Fl
- 97 E 31 St St Unit 3
- 97 E 31 St St
- 97 E 31st St Unit TOWNHOUSE
- 97 E 31st St Unit 3
- 97 E 31 St
- 97 E 31 St Unit TOWNHOUSE
- 99 E 31st St
- 95 E 31st St
- 93 E 31st St
- 101 E 31st St
- 91 E 31st St
- 103 E 31st St
- 105 E 31 St
- 105 E 31 St St Unit 2
- 87 E 31st St
- 87 E 31st St Unit 6
- 105 E 31st St
- 105 E 31st St Unit 2
- 85 E 31st St
Your Personal Tour Guide
Ask me questions while you tour the home.