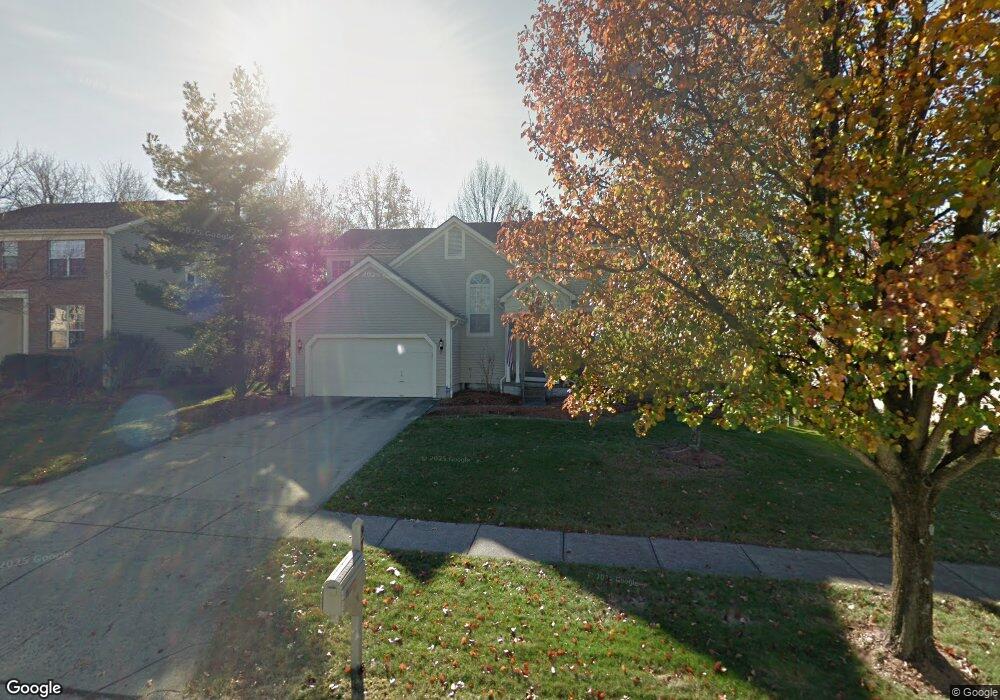
97 Highmeadow Dr Columbus, OH 43230
Cherry Bottom NeighborhoodEstimated Value: $449,000 - $480,000
4
Beds
3
Baths
2,058
Sq Ft
$224/Sq Ft
Est. Value
About This Home
This home is located at 97 Highmeadow Dr, Columbus, OH 43230 and is currently estimated at $460,276, approximately $223 per square foot. 97 Highmeadow Dr is a home located in Franklin County with nearby schools including Jefferson Elementary School, Gahanna East Middle School, and Lincoln High School.
Ownership History
Date
Name
Owned For
Owner Type
Purchase Details
Closed on
Jun 12, 2021
Sold by
Peters Kristina M
Bought by
Peters Richard D and Peters Kristina M
Current Estimated Value
Purchase Details
Closed on
Jun 16, 2006
Sold by
Peters Richard D and Peters Kristina M
Bought by
Peters Kristina M
Purchase Details
Closed on
Oct 20, 2000
Sold by
Jap Robby E and Jap Lily T
Bought by
Peters Richard D and Peters Kristina M
Home Financials for this Owner
Home Financials are based on the most recent Mortgage that was taken out on this home.
Original Mortgage
$159,600
Outstanding Balance
$55,222
Interest Rate
7.96%
Estimated Equity
$405,054
Purchase Details
Closed on
Jun 19, 1996
Sold by
Marchionda Albert
Bought by
Jap Robby E and Jap Lily T
Home Financials for this Owner
Home Financials are based on the most recent Mortgage that was taken out on this home.
Original Mortgage
$127,900
Interest Rate
8.29%
Mortgage Type
New Conventional
Purchase Details
Closed on
Sep 27, 1989
Create a Home Valuation Report for This Property
The Home Valuation Report is an in-depth analysis detailing your home's value as well as a comparison with similar homes in the area
Home Values in the Area
Average Home Value in this Area
Purchase History
We collect this data history from publicly available records. To have your information removed, we recommend requesting removal directly through your county’s website.
| Date | Buyer | Sale Price | Title Company |
|---|---|---|---|
| Peters Richard D | -- | None Available | |
| Peters Kristina M | -- | None Available | |
| Peters Richard D | $199,500 | Central City Title Agency | |
| Jap Robby E | $178,500 | -- | |
| -- | $139,300 | -- |
Source: Public Records
Mortgage History
We collect this data history from publicly available records. To have your information removed, we recommend requesting removal directly through your county’s website.
| Date | Status | Borrower | Loan Amount |
|---|---|---|---|
| Open | Peters Richard D | $159,600 | |
| Previous Owner | Jap Robby E | $127,900 |
Source: Public Records
Tax History
| Year | Tax Paid | Tax Assessment Tax Assessment Total Assessment is a certain percentage of the fair market value that is determined by local assessors to be the total taxable value of land and additions on the property. | Land | Improvement |
|---|---|---|---|---|
| 2025 | $8,287 | $135,450 | $34,300 | $101,150 |
| 2024 | $8,287 | $135,450 | $34,300 | $101,150 |
| 2023 | $8,187 | $135,450 | $34,300 | $101,150 |
| 2022 | $6,833 | $91,500 | $15,720 | $75,780 |
| 2021 | $6,609 | $91,500 | $15,720 | $75,780 |
| 2020 | $6,553 | $91,500 | $15,720 | $75,780 |
| 2019 | $5,442 | $75,820 | $13,130 | $62,690 |
| 2018 | $5,329 | $75,820 | $13,130 | $62,690 |
| 2017 | $5,122 | $75,820 | $13,130 | $62,690 |
| 2016 | $5,250 | $72,590 | $17,990 | $54,600 |
| 2015 | $5,255 | $72,590 | $17,990 | $54,600 |
| 2014 | $5,214 | $72,590 | $17,990 | $54,600 |
| 2013 | $2,589 | $72,590 | $17,990 | $54,600 |
Source: Public Records
Map
Nearby Homes
- 114 Highmeadow Dr
- 176 Highmeadow Dr
- 194 Highmeadow Dr
- 144 Garston Ct
- 3954 Stapleford Dr Unit 3954
- 3974 Declaration Dr
- 5500 Rushden Dr
- 285 Villa Oaks Ln Unit 285
- 5483 Broadview Rd
- 5610 Columbard Way Unit 10
- 360 Villa Oaks Ln Unit 360
- 4148 Panorama Dr
- 5594 Big Timber Ct
- 4574 N Hamilton Rd
- 4098 Asbury Ridge Dr
- 950 Ridenour Rd
- 1183 Sanctuary Place Unit 11
- 4335 Bear Tooth Ct
- 5156 Locust Post Ln
- 536 Calkin Ln E Unit 23
- 87 Highmeadow Dr
- 107 Highmeadow Dr
- 77 Highmeadow Dr
- 117 Highmeadow Dr
- 96 Highmeadow Dr
- 106 Highmeadow Dr
- 88 Highmeadow Dr
- 127 Highmeadow Dr
- 78 Highmeadow Dr
- 1278 Ashburnham Dr
- 1266 Ashburnham Dr
- 124 Highmeadow Dr
- 70 Highmeadow Dr
- 137 Highmeadow Dr
- 1256 Ashburnham Dr
- 132 Highmeadow Dr
- 62 Highmeadow Dr
- 1248 Ashburnham Dr
- 147 Highmeadow Dr
- 140 Highmeadow Dr
Your Personal Tour Guide
Ask me questions while you tour the home.