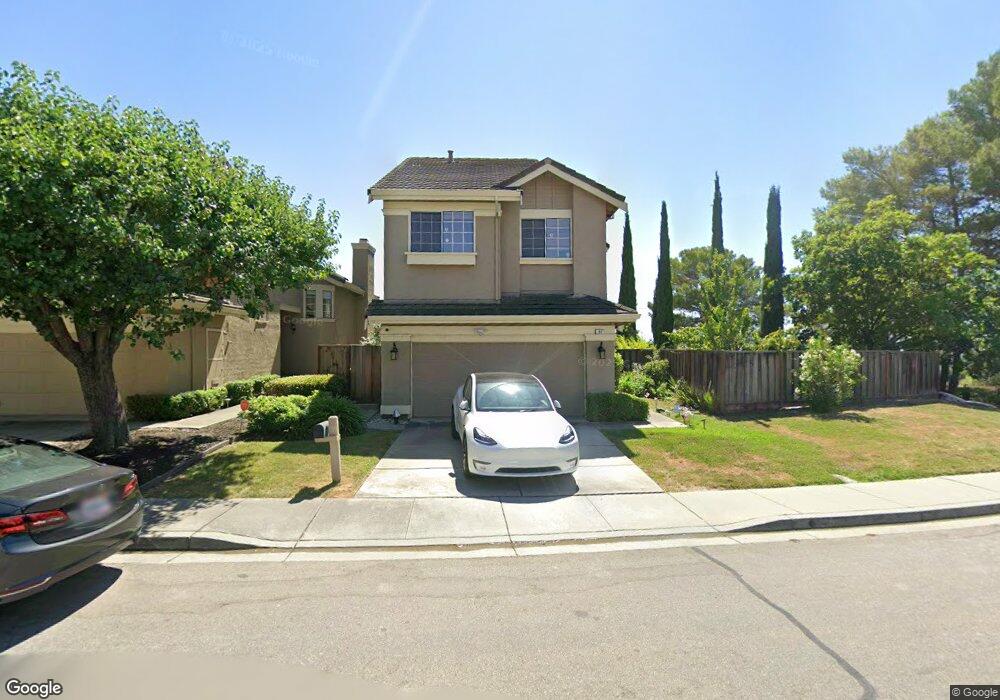
97 Rabbit Ct Fremont, CA 94539
Weibel NeighborhoodEstimated Value: $2,071,000 - $2,403,000
4
Beds
3
Baths
1,960
Sq Ft
$1,140/Sq Ft
Est. Value
About This Home
This home is located at 97 Rabbit Ct, Fremont, CA 94539 and is currently estimated at $2,234,709, approximately $1,140 per square foot. 97 Rabbit Ct is a home located in Alameda County with nearby schools including Fred E. Weibel Elementary School, John M. Horner Junior High School, and Irvington High School.
Ownership History
Date
Name
Owned For
Owner Type
Purchase Details
Closed on
May 20, 2016
Sold by
Peela Bhaskara and Peela Bhaskari
Bought by
The Peela Family Revocable Trust
Current Estimated Value
Home Financials for this Owner
Home Financials are based on the most recent Mortgage that was taken out on this home.
Original Mortgage
$577,341
Outstanding Balance
$255,076
Interest Rate
3.58%
Mortgage Type
New Conventional
Estimated Equity
$1,979,633
Purchase Details
Closed on
Jul 25, 2012
Sold by
Peela Bhaskara and Peela Bhaskari
Bought by
Peela Bhaskara and Peela Bhaskari
Home Financials for this Owner
Home Financials are based on the most recent Mortgage that was taken out on this home.
Original Mortgage
$622,000
Interest Rate
3.56%
Mortgage Type
New Conventional
Purchase Details
Closed on
Dec 30, 2011
Sold by
Peela Bhaskara and Peela Bhaskari
Bought by
Peela Bhaskara and Peela Bhaskari
Home Financials for this Owner
Home Financials are based on the most recent Mortgage that was taken out on this home.
Original Mortgage
$625,000
Interest Rate
3.96%
Mortgage Type
New Conventional
Purchase Details
Closed on
May 10, 2011
Sold by
Peela Bhaskara and Peela Bhaskari
Bought by
Peela Bhaskara and Peela Bhaskari
Purchase Details
Closed on
Mar 5, 2010
Sold by
Sun Zheng and Chang Tien Chi
Bought by
Peela Bhaskara and Peela Bhaskari
Home Financials for this Owner
Home Financials are based on the most recent Mortgage that was taken out on this home.
Original Mortgage
$650,400
Interest Rate
4.93%
Mortgage Type
New Conventional
Purchase Details
Closed on
Nov 3, 2005
Sold by
Sun Buddy and Tang Wei
Bought by
Sun Zheng and Chang Tien Chi
Home Financials for this Owner
Home Financials are based on the most recent Mortgage that was taken out on this home.
Original Mortgage
$648,000
Interest Rate
5.74%
Mortgage Type
Fannie Mae Freddie Mac
Purchase Details
Closed on
Jan 27, 2000
Sold by
Yerrapragada Chaya
Bought by
Sun Buddy and Tang Wei
Home Financials for this Owner
Home Financials are based on the most recent Mortgage that was taken out on this home.
Original Mortgage
$430,400
Interest Rate
7.75%
Purchase Details
Closed on
Jul 13, 1998
Sold by
Chillakanti Pratap
Bought by
Yerrapragada Chaya
Create a Home Valuation Report for This Property
The Home Valuation Report is an in-depth analysis detailing your home's value as well as a comparison with similar homes in the area
Home Values in the Area
Average Home Value in this Area
Purchase History
| Date | Buyer | Sale Price | Title Company |
|---|---|---|---|
| The Peela Family Revocable Trust | -- | First American Title Company | |
| Peela Bhaskara | -- | First American Title Company | |
| Peela Bhaskara | -- | First American Title Company | |
| Peela Bhaskara | -- | First American Title Company | |
| Peela Bhaskara | -- | First American Title Company | |
| Peela Bhaskara | -- | First American Title Company | |
| Peela Bhaskara | -- | None Available | |
| Peela Bhaskara | $813,000 | First American Title Company | |
| Sun Zheng | $825,000 | First American Title Co | |
| Sun Buddy | $538,000 | American Title Co | |
| Yerrapragada Chaya | -- | Old Republic Title Company | |
| Yerrapragada Chaya | $490,000 | Old Republic Title Company |
Source: Public Records
Mortgage History
| Date | Status | Borrower | Loan Amount |
|---|---|---|---|
| Open | Peela Bhaskara | $577,341 | |
| Closed | Peela Bhaskara | $622,000 | |
| Closed | Peela Bhaskara | $625,000 | |
| Closed | Peela Bhaskara | $650,400 | |
| Previous Owner | Sun Zheng | $648,000 | |
| Previous Owner | Sun Buddy | $430,400 |
Source: Public Records
Tax History Compared to Growth
Tax History
| Year | Tax Paid | Tax Assessment Tax Assessment Total Assessment is a certain percentage of the fair market value that is determined by local assessors to be the total taxable value of land and additions on the property. | Land | Improvement |
|---|---|---|---|---|
| 2025 | $12,480 | $1,049,363 | $314,809 | $734,554 |
| 2024 | $12,480 | $1,028,794 | $308,638 | $720,156 |
| 2023 | $12,152 | $1,008,623 | $302,587 | $706,036 |
| 2022 | $12,004 | $988,851 | $296,655 | $692,196 |
| 2021 | $11,709 | $969,468 | $290,840 | $678,628 |
| 2020 | $11,768 | $959,534 | $287,860 | $671,674 |
| 2019 | $11,634 | $940,721 | $282,216 | $658,505 |
| 2018 | $11,409 | $922,283 | $276,685 | $645,598 |
| 2017 | $11,043 | $904,201 | $271,260 | $632,941 |
| 2016 | $10,859 | $886,478 | $265,943 | $620,535 |
| 2015 | $10,718 | $873,170 | $261,951 | $611,219 |
| 2014 | $10,537 | $856,071 | $256,821 | $599,250 |
Source: Public Records
Map
Nearby Homes
- 1910 Vinehill Cir
- 379 Felipe Common
- 44989 Vista Del Sol
- 44423 View Point Cir
- 130 Kootenai Dr
- 45897 Bridgeport Place
- 44916 Winding Ln
- 45258 Tom Blalock St Unit 100
- 1748 Kilowatt Way Unit 301
- 45128 Warm Springs Blvd Unit 323
- 45128 Warm Springs Blvd Unit 523
- 2250 Kilowatt Way Unit 214
- 646 Bella Vista Ct
- 46925 Aloe Ct
- 46935 Aloe Ct
- 483 Becado Place
- 43555 Puesta Del Sol
- 42099 Vinha Way
- 43547 Ellsworth St
- 46762 Winema Common