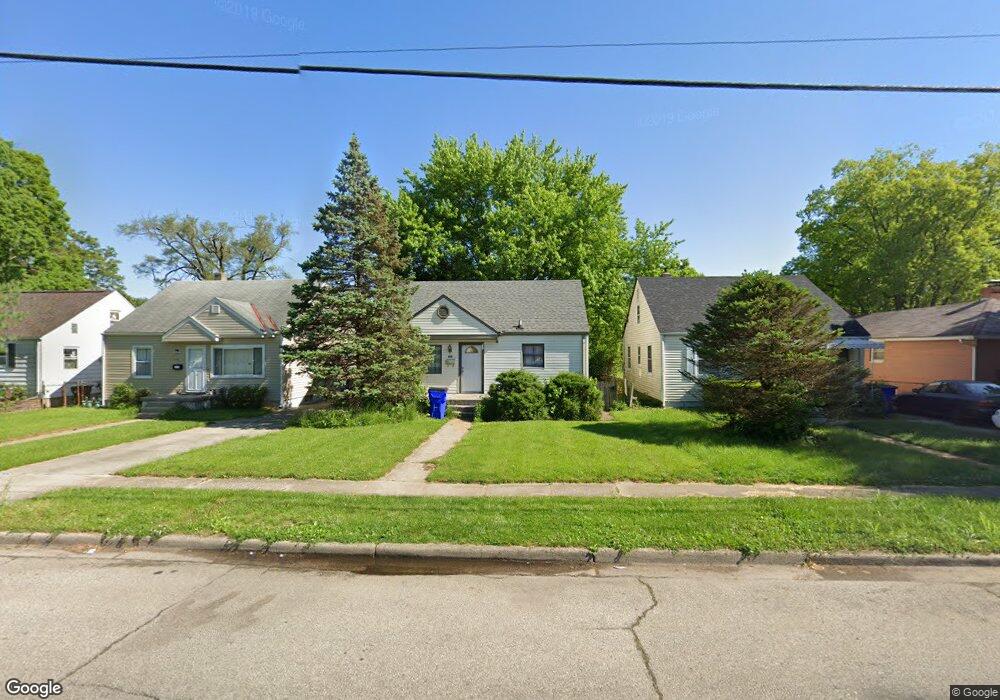
970 Saint Clair Ave Hamilton, OH 45015
East Hamilton NeighborhoodEstimated Value: $173,000 - $236,000
3
Beds
2
Baths
1,560
Sq Ft
$135/Sq Ft
Est. Value
About This Home
This home is located at 970 Saint Clair Ave, Hamilton, OH 45015 and is currently estimated at $210,160, approximately $134 per square foot. 970 Saint Clair Ave is a home located in Butler County with nearby schools including Linden Elementary School, Garfield Middle School, and Hamilton Freshman School.
Ownership History
Date
Name
Owned For
Owner Type
Purchase Details
Closed on
May 21, 2010
Sold by
Mcintosh Holly and Mcintosh Randy
Bought by
Isreal Shaurita D
Current Estimated Value
Home Financials for this Owner
Home Financials are based on the most recent Mortgage that was taken out on this home.
Original Mortgage
$95,899
Outstanding Balance
$63,532
Interest Rate
5.05%
Mortgage Type
FHA
Estimated Equity
$146,628
Purchase Details
Closed on
Sep 1, 2009
Sold by
Fannie Mae
Bought by
Mcintosh Holly
Purchase Details
Closed on
Aug 26, 2009
Sold by
Powers Sheila C
Bought by
Fanniemae and Federal National Mortgage Association
Purchase Details
Closed on
Jul 30, 1998
Sold by
King Shelley S and King Jeffrey S
Bought by
Powers Sheila C
Home Financials for this Owner
Home Financials are based on the most recent Mortgage that was taken out on this home.
Original Mortgage
$79,450
Interest Rate
7.03%
Mortgage Type
Purchase Money Mortgage
Purchase Details
Closed on
Jul 1, 1993
Create a Home Valuation Report for This Property
The Home Valuation Report is an in-depth analysis detailing your home's value as well as a comparison with similar homes in the area
Home Values in the Area
Average Home Value in this Area
Purchase History
| Date | Buyer | Sale Price | Title Company |
|---|---|---|---|
| Isreal Shaurita D | $99,500 | Lawyers Title Of Cincinnati | |
| Mcintosh Holly | $45,000 | Ohio Title Corporation | |
| Fanniemae | $40,000 | Ohio Title Corporation Ne | |
| Powers Sheila C | $81,900 | -- | |
| -- | $57,900 | -- |
Source: Public Records
Mortgage History
| Date | Status | Borrower | Loan Amount |
|---|---|---|---|
| Open | Isreal Shaurita D | $95,899 | |
| Previous Owner | Powers Sheila C | $79,450 |
Source: Public Records
Tax History
| Year | Tax Paid | Tax Assessment Tax Assessment Total Assessment is a certain percentage of the fair market value that is determined by local assessors to be the total taxable value of land and additions on the property. | Land | Improvement |
|---|---|---|---|---|
| 2025 | $1,986 | $47,060 | $8,650 | $38,410 |
| 2024 | $1,986 | $47,060 | $8,650 | $38,410 |
| 2023 | $1,977 | $47,060 | $8,650 | $38,410 |
| 2022 | $1,716 | $34,600 | $8,650 | $25,950 |
| 2021 | $1,518 | $33,510 | $8,650 | $24,860 |
| 2020 | $1,581 | $33,510 | $8,650 | $24,860 |
| 2019 | $2,096 | $28,620 | $8,090 | $20,530 |
| 2018 | $1,330 | $28,620 | $8,090 | $20,530 |
| 2017 | $1,342 | $28,620 | $8,090 | $20,530 |
| 2016 | $1,288 | $26,190 | $8,090 | $18,100 |
| 2015 | $1,281 | $26,190 | $8,090 | $18,100 |
| 2014 | $1,403 | $26,190 | $8,090 | $18,100 |
| 2013 | $1,403 | $30,540 | $8,090 | $22,450 |
Source: Public Records
Map
Nearby Homes
- 980 Bishop Ave
- 810 Allen Ave
- 3841 Hammond Blvd
- 0 Foster Ave
- 610 Hayes Ave
- 1154 Noyes Ave
- 3865 Arlington Ave
- 920 Tiffin Ave
- 717 Hooven Ave
- 3951 Dixie Hwy
- 0 Dixie Hwy
- 1018 Minor Ave
- 822 Minor Ave
- 639 Minor Ave
- 332 Chase Ave
- 1036 Weller Ave
- 4708 Fairfield Ave
- 2775 Pleasant Ave
- 336 Hooven Ave
- 517 Laurel Ave
- 980 Saint Clair Ave
- 960 Saint Clair Ave
- 3795 Putnam Ave
- 950 Saint Clair Ave
- 940 Saint Clair Ave
- 940 Saint Clair Ave
- 929 Allen Ave
- 24 Saint Clair Ave Unit 24
- 935 Allen Ave
- 925 Allen Ave
- 937 Allen Ave
- 921 Allen Ave
- 920 Saint Clair Ave
- 985 Saint Clair Ave
- 1006 Saint Clair Ave
- 3750 Putnam Ave
- 917 Allen Ave
- 915 Allen Ave
- 971 Saint Clair Ave
- 3700 Putnam Ave
Your Personal Tour Guide
Ask me questions while you tour the home.