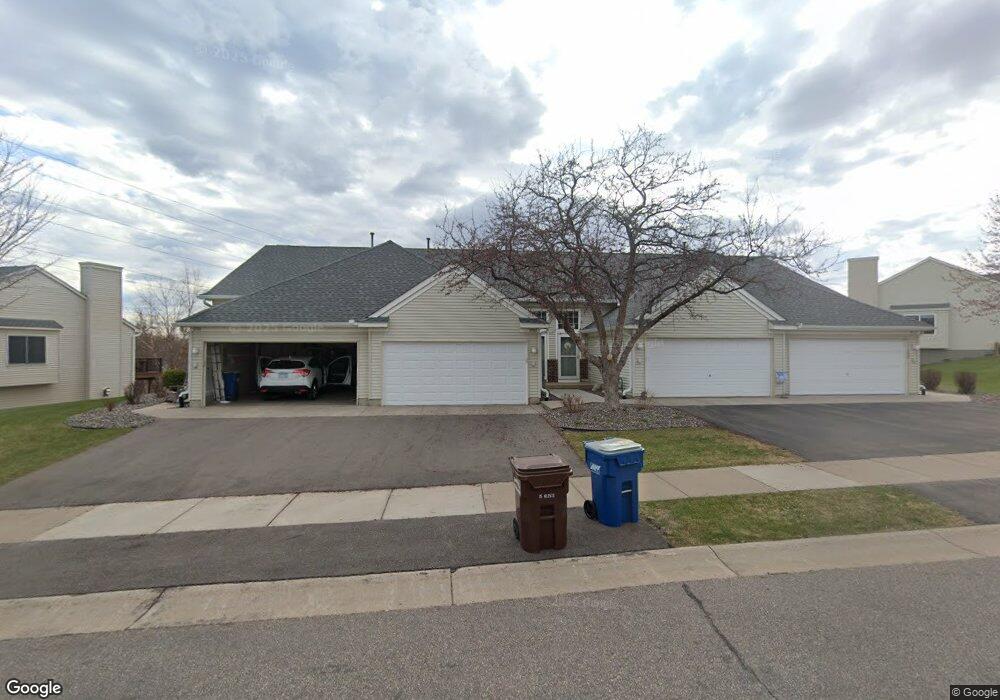
9707 Xenium Ln N Maple Grove, MN 55369
Estimated Value: $267,851 - $289,000
2
Beds
2
Baths
1,650
Sq Ft
$170/Sq Ft
Est. Value
About This Home
This home is located at 9707 Xenium Ln N, Maple Grove, MN 55369 and is currently estimated at $280,213, approximately $169 per square foot. 9707 Xenium Ln N is a home located in Hennepin County with nearby schools including Fernbrook Elementary School, Osseo Middle School, and Maple Grove Senior High School.
Ownership History
Date
Name
Owned For
Owner Type
Purchase Details
Closed on
Aug 3, 2015
Sold by
Carmody Kathleen Kathleen
Bought by
Farris Marietta Marietta
Current Estimated Value
Home Financials for this Owner
Home Financials are based on the most recent Mortgage that was taken out on this home.
Original Mortgage
$162,545
Outstanding Balance
$127,623
Interest Rate
3.98%
Estimated Equity
$152,590
Purchase Details
Closed on
Dec 30, 2010
Sold by
Mihalchick Steve M and Mihalchick Carol J
Bought by
Carmody Kathleen A
Purchase Details
Closed on
Aug 16, 2005
Sold by
Laven Pamela J
Bought by
Mihalchick Steve M and Mihalchick Carol J
Purchase Details
Closed on
Feb 26, 1999
Sold by
The Rottlund Company Inc
Bought by
Laven Pamela J
Purchase Details
Closed on
Sep 21, 1998
Sold by
Arcon Development Inc
Bought by
The Rottlund Company Inc
Create a Home Valuation Report for This Property
The Home Valuation Report is an in-depth analysis detailing your home's value as well as a comparison with similar homes in the area
Home Values in the Area
Average Home Value in this Area
Purchase History
| Date | Buyer | Sale Price | Title Company |
|---|---|---|---|
| Farris Marietta Marietta | $177,500 | -- | |
| Carmody Kathleen A | $154,000 | -- | |
| Mihalchick Steve M | $205,000 | -- | |
| Laven Pamela J | $116,900 | -- | |
| The Rottlund Company Inc | $196,000 | -- |
Source: Public Records
Mortgage History
| Date | Status | Borrower | Loan Amount |
|---|---|---|---|
| Open | Farris Marietta Marietta | $162,545 |
Source: Public Records
Tax History
| Year | Tax Paid | Tax Assessment Tax Assessment Total Assessment is a certain percentage of the fair market value that is determined by local assessors to be the total taxable value of land and additions on the property. | Land | Improvement |
|---|---|---|---|---|
| 2024 | $3,152 | $276,600 | $66,700 | $209,900 |
| 2023 | $3,329 | $292,400 | $91,600 | $200,800 |
| 2022 | $2,525 | $264,400 | $52,800 | $211,600 |
| 2021 | $2,579 | $222,200 | $46,000 | $176,200 |
| 2020 | $2,410 | $222,900 | $55,000 | $167,900 |
| 2019 | $2,296 | $200,800 | $42,600 | $158,200 |
| 2018 | $2,181 | $183,300 | $39,000 | $144,300 |
| 2017 | $2,202 | $168,300 | $47,000 | $121,300 |
| 2016 | $2,056 | $157,200 | $46,500 | $110,700 |
| 2015 | $2,030 | $152,000 | $45,000 | $107,000 |
| 2014 | -- | $122,200 | $33,000 | $89,200 |
Source: Public Records
Map
Nearby Homes
- 13327 Territorial Cir N
- 13485 Territorial Cir N
- 9244 Zinnia Ln N
- 13810 102nd Ct N
- 10269 Chesshire Ln N
- 13154 90th Place N
- 13152 90th Place N
- 9323 Magnolia Ln N
- 13940 90th Place N
- 14700 105th Place N
- 14453 103rd Place N
- 14465 103rd Place N
- 14473 103rd Place N
- 14481 103rd Place N
- 14399 104th Ave N
- 14491 103rd Place N
- 14499 103rd Place N
- 12635 91st Ave N
- 10625 Juneau Ln N
- 8940 Yucca Ln N
- 9713 Xenium Ln N
- 9701 Xenium Ln N
- 9719 Xenium Ln N
- 9699 Xenium Ln N
- 9693 Xenium Ln N
- 13591 97th Place N
- 9687 Xenium Ln N
- 13599 97th Place N
- 9681 Xenium Ln N
- 13607 97th Place N
- 9712 Xenium Ln N
- 9706 Xenium Ln N
- 9718 Xenium Ln N
- 9700 Xenium Ln N
- 9724 Xenium Ln N
- 13615 97th Place N
- 9730 Xenium Ln N
- 9736 Xenium Ln N
- 9742 Xenium Ln N
- 13490 97th Ave N
Your Personal Tour Guide
Ask me questions while you tour the home.