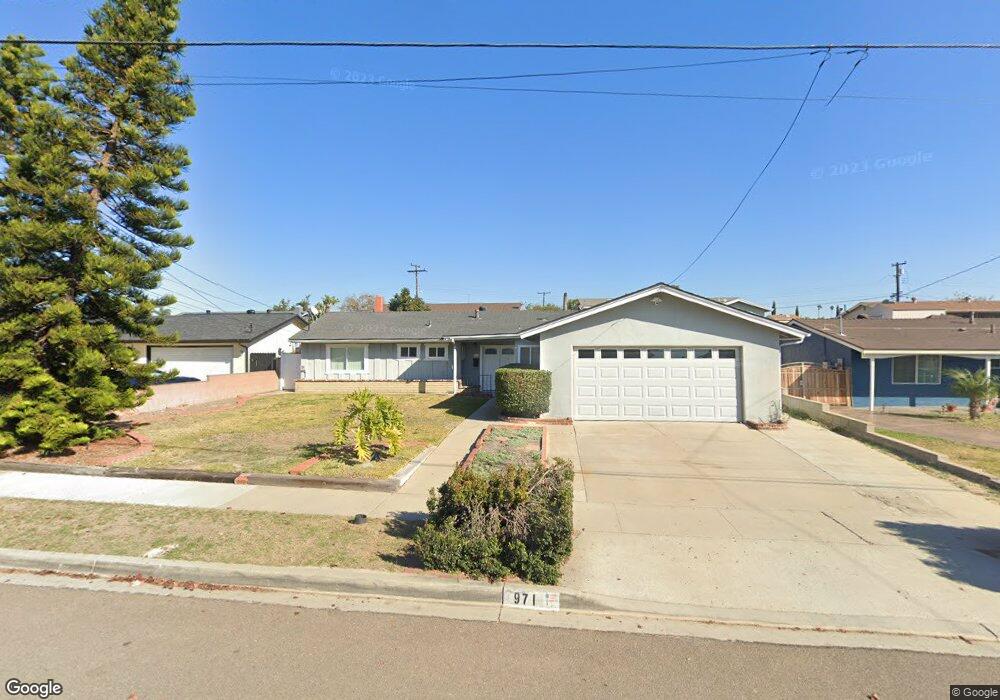
971 Maria Way Chula Vista, CA 91911
Castle Park NeighborhoodEstimated Value: $805,000 - $978,000
4
Beds
2
Baths
1,539
Sq Ft
$566/Sq Ft
Est. Value
About This Home
This home is located at 971 Maria Way, Chula Vista, CA 91911 and is currently estimated at $871,048, approximately $565 per square foot. 971 Maria Way is a home located in San Diego County with nearby schools including Karl H Kellogg Elementary School, Hilltop Middle School, and Hilltop Senior High School.
Ownership History
Date
Name
Owned For
Owner Type
Purchase Details
Closed on
May 16, 2014
Sold by
Robinson Crystal T and Robinson Crystal
Bought by
Robinson Crystal T and The Crystal T Robinson Trust
Current Estimated Value
Purchase Details
Closed on
Mar 21, 2012
Sold by
Fernandez Julio C and Fernandez Minerva Q
Bought by
Robinson Crystal
Home Financials for this Owner
Home Financials are based on the most recent Mortgage that was taken out on this home.
Original Mortgage
$263,155
Outstanding Balance
$179,731
Interest Rate
3.75%
Mortgage Type
FHA
Estimated Equity
$691,317
Purchase Details
Closed on
Sep 25, 2003
Sold by
Vestal Rodney Bruce
Bought by
Fernandez Julio C and Fernandez Minerva Q
Home Financials for this Owner
Home Financials are based on the most recent Mortgage that was taken out on this home.
Original Mortgage
$361,000
Interest Rate
5.5%
Mortgage Type
Purchase Money Mortgage
Purchase Details
Closed on
May 17, 2003
Sold by
Baltierra Joy E
Bought by
Baltierra Joy E
Create a Home Valuation Report for This Property
The Home Valuation Report is an in-depth analysis detailing your home's value as well as a comparison with similar homes in the area
Home Values in the Area
Average Home Value in this Area
Purchase History
| Date | Buyer | Sale Price | Title Company |
|---|---|---|---|
| Robinson Crystal T | -- | None Available | |
| Robinson Crystal | $270,000 | Fidelity National Title | |
| Fernandez Julio C | $380,000 | Lawyers Title | |
| Baltierra Joy E | -- | -- |
Source: Public Records
Mortgage History
| Date | Status | Borrower | Loan Amount |
|---|---|---|---|
| Open | Robinson Crystal | $263,155 | |
| Previous Owner | Fernandez Julio C | $361,000 |
Source: Public Records
Tax History Compared to Growth
Tax History
| Year | Tax Paid | Tax Assessment Tax Assessment Total Assessment is a certain percentage of the fair market value that is determined by local assessors to be the total taxable value of land and additions on the property. | Land | Improvement |
|---|---|---|---|---|
| 2025 | $3,838 | $339,123 | $133,181 | $205,942 |
| 2024 | $3,838 | $332,474 | $130,570 | $201,904 |
| 2023 | $3,784 | $325,956 | $128,010 | $197,946 |
| 2022 | $3,674 | $319,565 | $125,500 | $194,065 |
| 2021 | $3,588 | $313,300 | $123,040 | $190,260 |
| 2020 | $3,502 | $310,089 | $121,779 | $188,310 |
| 2019 | $3,410 | $304,010 | $119,392 | $184,618 |
| 2018 | $3,356 | $298,050 | $117,051 | $180,999 |
| 2017 | $3,284 | $292,206 | $114,756 | $177,450 |
| 2016 | $3,206 | $286,477 | $112,506 | $173,971 |
| 2015 | $3,160 | $282,175 | $110,817 | $171,358 |
| 2014 | $3,106 | $276,649 | $108,647 | $168,002 |
Source: Public Records
Map
Nearby Homes
- 158 E L St
- 953 Barrett Ave
- 859 Tamayo Dr Unit 2
- 859 Tamayo Dr Unit 1
- 835 Tamayo Dr Unit 6
- 52 E L St
- 62 E Palomar Dr
- 814 Tamayo Dr Unit 2
- 1184 Monterey Place
- 202 E J St
- 826 Floyd Ave
- 838 David Dr
- 1267 Melrose Ave
- 620 Telegraph Canyon Rd Unit C
- 152 E Orlando St
- 1241 Raven Ave
- 647 Claire Ave
- 1296 Finch Place
- 96 E Palomar St
- 514 Avenida Centro Unit 105