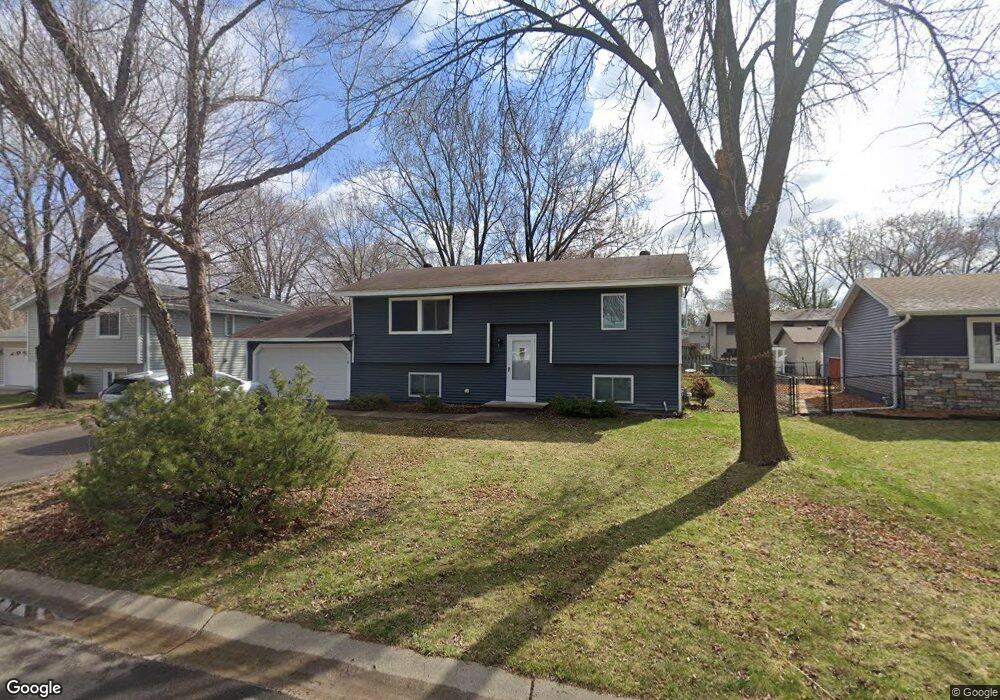
9710 Forestview Ln N Maple Grove, MN 55369
Estimated Value: $327,000 - $384,000
4
Beds
2
Baths
905
Sq Ft
$387/Sq Ft
Est. Value
About This Home
This home is located at 9710 Forestview Ln N, Maple Grove, MN 55369 and is currently estimated at $350,265, approximately $387 per square foot. 9710 Forestview Ln N is a home located in Hennepin County with nearby schools including Elm Creek Elementary School, Osseo Middle School, and Osseo Senior High School.
Ownership History
Date
Name
Owned For
Owner Type
Purchase Details
Closed on
Jan 3, 2019
Sold by
Hanson Brothers Inv Group Llc
Bought by
B & H Invs Llc
Current Estimated Value
Home Financials for this Owner
Home Financials are based on the most recent Mortgage that was taken out on this home.
Original Mortgage
$150,000
Outstanding Balance
$125,172
Interest Rate
4.7%
Mortgage Type
Commercial
Estimated Equity
$225,093
Purchase Details
Closed on
Jan 3, 2018
Sold by
Hanson Brothers Investment Group Llc
Bought by
Bh Investments Llc
Purchase Details
Closed on
Sep 15, 2011
Sold by
Federal National Mortgage Association
Bought by
Hbig Llc
Purchase Details
Closed on
Oct 15, 2010
Sold by
Matayo Diana J
Bought by
Everhome Mortgage Company
Purchase Details
Closed on
Aug 27, 2004
Sold by
Hartling James and Hartling Carmen Mae
Bought by
Matayo Lubakare L and Matayo Diana J
Create a Home Valuation Report for This Property
The Home Valuation Report is an in-depth analysis detailing your home's value as well as a comparison with similar homes in the area
Home Values in the Area
Average Home Value in this Area
Purchase History
| Date | Buyer | Sale Price | Title Company |
|---|---|---|---|
| B & H Invs Llc | $500 | Stewart Title Company | |
| B & H Invs Llc | $500 | Stewart Title Company | |
| Bh Investments Llc | -- | Stewart Title Co | |
| Hbig Llc | -- | First Financial Title Agency | |
| Everhome Mortgage Company | $145,488 | -- | |
| Matayo Lubakare L | $183,900 | -- |
Source: Public Records
Mortgage History
| Date | Status | Borrower | Loan Amount |
|---|---|---|---|
| Open | B & H Invs Llc | $150,000 |
Source: Public Records
Tax History Compared to Growth
Tax History
| Year | Tax Paid | Tax Assessment Tax Assessment Total Assessment is a certain percentage of the fair market value that is determined by local assessors to be the total taxable value of land and additions on the property. | Land | Improvement |
|---|---|---|---|---|
| 2024 | $3,987 | $327,800 | $98,800 | $229,000 |
| 2023 | $3,921 | $334,300 | $104,500 | $229,800 |
| 2022 | $3,158 | $321,000 | $95,800 | $225,200 |
| 2021 | $2,865 | $260,200 | $73,700 | $186,500 |
| 2020 | $3,005 | $232,100 | $50,500 | $181,600 |
| 2019 | $2,819 | $231,200 | $59,300 | $171,900 |
| 2018 | $2,667 | $204,700 | $43,000 | $161,700 |
| 2017 | $2,777 | $189,600 | $51,000 | $138,600 |
| 2016 | $2,907 | $195,700 | $65,000 | $130,700 |
| 2015 | $2,644 | $173,100 | $47,500 | $125,600 |
| 2014 | -- | $147,200 | $33,500 | $113,700 |
Source: Public Records
Map
Nearby Homes
- 9880 Cottonwood Ln N
- 6866 Zachary Ln N
- 9311 Kirkwood Ln N
- 9323 Kirkwood Ln N
- 9201 Forestview Ln N
- 9323 Magnolia Ln N
- 12795 95th Ave N
- 9132 Kirkwood Ln N
- 9058 Goldenrod Ln N
- 12599 91st Place N
- 9501 Revere Ln N
- 11043 104th Place N
- 11760 88th Place N
- 8864 Cottonwood Ln N
- 10162 93rd Ave N
- 14877 106th Ave N
- 13391 Territorial Cir N
- 13434 Territorial Cir N
- 11631 88th Ave N
- 9061 Underwood Ln N
- 9720 Forestview Ln N
- 11690 97th Ave N
- 11700 97th Ave N
- 9711 Forestview Ln N
- 9730 Forestview Ln N
- 11680 97th Ave N
- 9721 Forestview Ln N
- 9701 Forestview Ln N
- 11693 97th Place N
- 11663 97th Place N
- 11860 97th Ave N
- 11670 97th Ave N
- 11850 97th Ave N
- 11639 97th Place N
- 11870 97th Ave N
- 11650 97th Ave N
- 11660 97th Ave N
- 11710 97th Place N
- 11690 97th Place N
- 11615 97th Place N