
Seller's Agent in 2019
Sharon Tzib
Walzel Properties - Corporate Office
(832) 745-8657
66 Total Sales

Estimated Value: $250,251 - $288,000
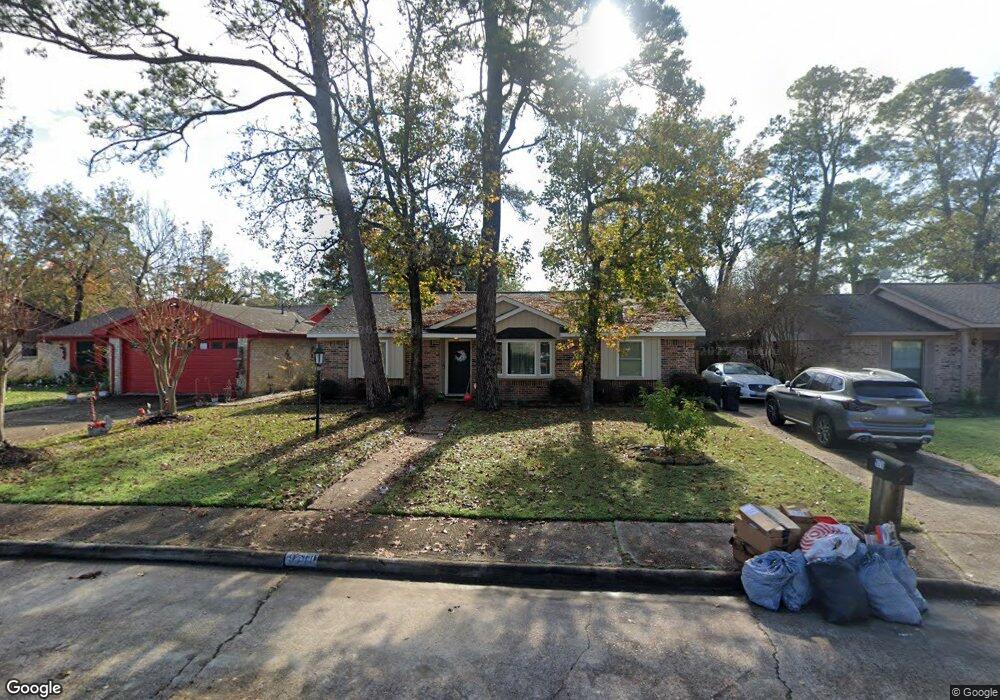
Hurry, this updated home will not last!! Single-story home is brimming with charm and so many extras!! Updated kitchen and baths, tile floors throughout except study with wood floors, granite counters in kitchen and baths, high ceiling in den w/ gas fireplace, open concept living, formal dining room w/ lovely bay window, and great party back yard w/ patio and enclosed portion of driveway for crawfish boils, birthday parties, etc! Inquire for improvements list, but roof replaced 2015, a/c 2013, water heater 2016. Painted inside & out 2016. Dual pane windows. Bedrooms feature ample closet space. Easy access to 249 & 99, shopping, dining & more. Klein ISD, close to schools - all grade levels! Mature neighborhood w/ trees, pool, & tennis court! Horseshoe street access so limited traffic. No flooding and low HOA dues! Come see this adorable property today and fall in love!
Last Agent to Sell the Property
Walzel Properties - Corporate Office License #0653488 Listed on: 03/13/2019
| Date | Buyer | Sale Price | Title Company |
|---|---|---|---|
| Hekymara Makena | -- | None Available | |
| Oraban Roth Ann | -- | Charter Title Co | |
| Phillips Renee | -- | Alamo Title Company |
| Date | Status | Borrower | Loan Amount |
|---|---|---|---|
| Open | Hekymara Makena | $176,641 | |
| Previous Owner | Oraban Roth Ann | $157,102 | |
| Previous Owner | Phillips Renee | $99,000 |
| Date | Event | Price | List to Sale | Price per Sq Ft |
|---|---|---|---|---|
| 12/31/2021 12/31/21 | Off Market | -- | -- | -- |
| 05/03/2019 05/03/19 | Sold | -- | -- | -- |
| 04/03/2019 04/03/19 | Pending | -- | -- | -- |
| 03/13/2019 03/13/19 | For Sale | $179,900 | -- | $100 / Sq Ft |
| Year | Tax Paid | Tax Assessment Tax Assessment Total Assessment is a certain percentage of the fair market value that is determined by local assessors to be the total taxable value of land and additions on the property. | Land | Improvement |
|---|---|---|---|---|
| 2025 | $3,808 | $260,358 | $56,194 | $204,164 |
| 2024 | $3,808 | $256,969 | $56,194 | $200,775 |
| 2023 | $3,808 | $273,235 | $56,194 | $217,041 |
| 2022 | $5,147 | $219,996 | $56,194 | $163,802 |
| 2021 | $5,156 | $206,529 | $25,452 | $181,077 |
| 2020 | $5,068 | $193,538 | $25,452 | $168,086 |
| 2019 | $4,256 | $155,400 | $25,452 | $129,948 |
| 2018 | $1,691 | $143,251 | $25,452 | $117,799 |
| 2017 | $3,929 | $143,251 | $25,452 | $117,799 |
| 2016 | $2,977 | $128,124 | $25,452 | $102,672 |
| 2015 | $2,153 | $124,956 | $25,452 | $99,504 |
| 2014 | $2,153 | $107,304 | $23,139 | $84,165 |
Seller's Agent in 2019
Sharon Tzib
Walzel Properties - Corporate Office
(832) 745-8657
66 Total Sales
J
Buyer's Agent in 2019
Jeremy Willard
Keller Williams Realty The Woodlands
(281) 364-1588
112 Total Sales
Source: Houston Association of REALTORS®
MLS Number: 26606944
APN: 1022910000003
Disclaimer: Certain information contained herein is derived from information provided by parties other than Homes.com. All information provided is deemed reliable, but is not guaranteed to be accurate and should be independently verified.
![]() Copyright 2026, Houston REALTORS® Information Service, Inc.
Copyright 2026, Houston REALTORS® Information Service, Inc.
The information provided is exclusively for consumers’ personal, non-commercial use, and may not be used for any purpose other than to identify prospective properties consumers may be interested in purchasing.
Information is deemed reliable but not guaranteed.
Ask me questions while you tour the home.