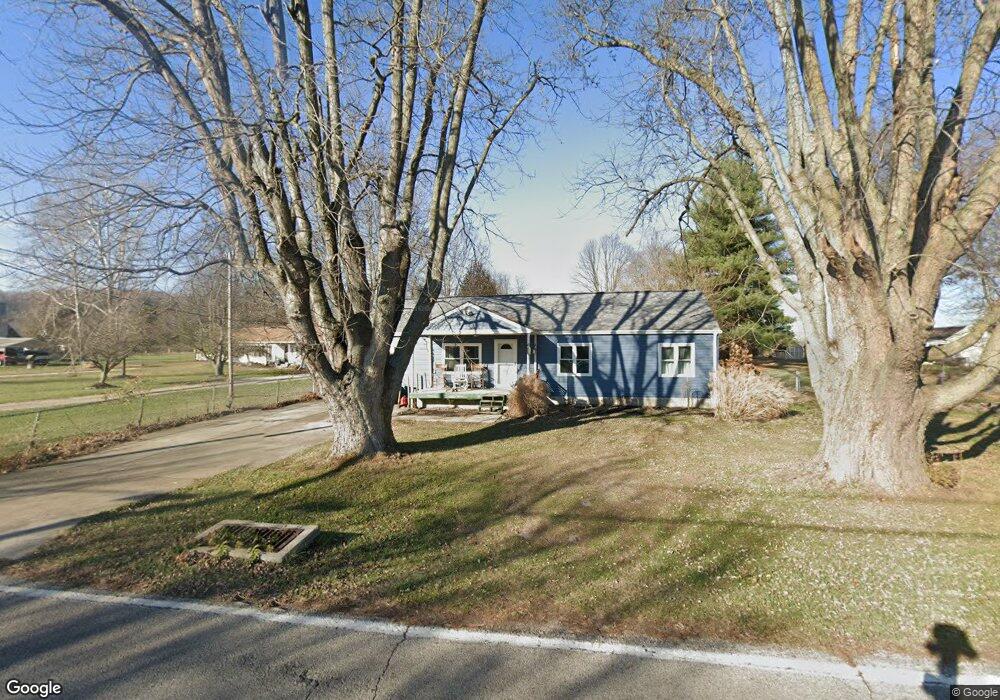
9712 Baughman Rd Harrison, OH 45030
Estimated Value: $226,553 - $351,000
3
Beds
1
Bath
1,300
Sq Ft
$202/Sq Ft
Est. Value
About This Home
This home is located at 9712 Baughman Rd, Harrison, OH 45030 and is currently estimated at $262,138, approximately $201 per square foot. 9712 Baughman Rd is a home located in Hamilton County with nearby schools including William Henry Harrison High School, St. John The Baptist School, and Summit Academy of Southwest Ohio.
Ownership History
Date
Name
Owned For
Owner Type
Purchase Details
Closed on
Jun 25, 2003
Sold by
Bott William Leslie Tr
Bought by
Bott William Leslie
Current Estimated Value
Purchase Details
Closed on
Mar 26, 1998
Sold by
Eckel Robert N
Bought by
Bott William Leslie
Purchase Details
Closed on
Nov 2, 1994
Sold by
Bischoff Clifford J and Bischoff Mary Grace
Bought by
Eckel Robert N
Home Financials for this Owner
Home Financials are based on the most recent Mortgage that was taken out on this home.
Original Mortgage
$65,550
Interest Rate
8.86%
Purchase Details
Closed on
Sep 20, 1994
Sold by
Ketterman Daniel Lynn
Bought by
Bischoff Clifford J and Bischoff Mary Grace
Home Financials for this Owner
Home Financials are based on the most recent Mortgage that was taken out on this home.
Original Mortgage
$65,550
Interest Rate
8.86%
Create a Home Valuation Report for This Property
The Home Valuation Report is an in-depth analysis detailing your home's value as well as a comparison with similar homes in the area
Home Values in the Area
Average Home Value in this Area
Purchase History
| Date | Buyer | Sale Price | Title Company |
|---|---|---|---|
| Bott William Leslie | -- | -- | |
| Bott William Leslie | $106,000 | -- | |
| Eckel Robert N | -- | -- | |
| Bischoff Clifford J | $50,000 | -- |
Source: Public Records
Mortgage History
| Date | Status | Borrower | Loan Amount |
|---|---|---|---|
| Previous Owner | Eckel Robert N | $65,550 |
Source: Public Records
Tax History Compared to Growth
Tax History
| Year | Tax Paid | Tax Assessment Tax Assessment Total Assessment is a certain percentage of the fair market value that is determined by local assessors to be the total taxable value of land and additions on the property. | Land | Improvement |
|---|---|---|---|---|
| 2024 | $2,012 | $48,979 | $15,435 | $33,544 |
| 2023 | $1,986 | $48,979 | $15,435 | $33,544 |
| 2022 | $1,819 | $39,036 | $16,611 | $22,425 |
| 2021 | $1,792 | $39,036 | $16,611 | $22,425 |
| 2020 | $1,790 | $39,036 | $16,611 | $22,425 |
| 2019 | $1,665 | $34,545 | $14,700 | $19,845 |
| 2018 | $1,674 | $34,545 | $14,700 | $19,845 |
| 2017 | $1,587 | $34,545 | $14,700 | $19,845 |
| 2016 | $1,419 | $33,439 | $14,406 | $19,033 |
| 2015 | $1,413 | $33,439 | $14,406 | $19,033 |
| 2014 | $1,416 | $33,439 | $14,406 | $19,033 |
| 2013 | $1,456 | $34,122 | $14,700 | $19,422 |
Source: Public Records
Map
Nearby Homes
- 1539 Sefton Dr
- 10390 Short Rd
- 9439 Tebbs Ct
- 1531 Barben Ct
- 1528 Fairchild Dr
- acres Edgewood Rd
- 1253 Trailhead Place
- 1307 Trailhead Place
- 5185 Brookfield Ln
- 10885 Mockernut Dr
- 1319 Trailhead Place
- 8972 Camberley St
- 2480 Bartram Ln
- 6033 Foothills Dr
- 1499 Deters Dr
- 1225 Trailhead Place
- 12010 Solitude Ct
- 8074 Rock Island Dr
- 1166 Trailhead Place
- 1269 Trailhead Place
- 9720 Baughman Rd
- 10709 Edgewood Rd
- 9707 Baughman Rd
- 9727 Baughman Rd
- 10744 Edgewood Rd
- 9735 Baughman Rd
- 9635 Jarrett Ct
- 9639 Jarrett Ct
- 9686 Baughman Rd
- 9631 Jarrett Ct
- 9740 Baughman Rd
- 10752 Edgewood Rd
- 9640 Jarrett Ct
- 9627 Jarrett Ct
- 9743 Baughman Rd
- 10760 Edgewood Rd
- 9678 Baughman Rd
- 10631 Edgewood Rd
- 10635 Edgewood Rd
- 9623 Jarrett Ct