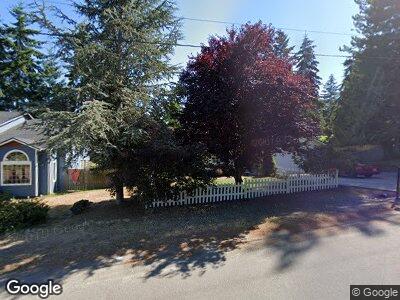
972 California Ave E Port Orchard, WA 98366
Manchester NeighborhoodEstimated Value: $403,000 - $423,618
3
Beds
2
Baths
1,064
Sq Ft
$389/Sq Ft
Est. Value
About This Home
This home is located at 972 California Ave E, Port Orchard, WA 98366 and is currently estimated at $414,405, approximately $389 per square foot. 972 California Ave E is a home located in Kitsap County with nearby schools including Manchester Elementary School, John Sedgwick Middle School, and South Kitsap High School.
Ownership History
Date
Name
Owned For
Owner Type
Purchase Details
Closed on
Jul 26, 2005
Sold by
Cook Melanie
Bought by
Cook James A and Cook Melanie
Current Estimated Value
Home Financials for this Owner
Home Financials are based on the most recent Mortgage that was taken out on this home.
Original Mortgage
$39,250
Interest Rate
5.56%
Mortgage Type
Stand Alone Second
Purchase Details
Closed on
Nov 22, 2004
Sold by
Cook James A
Bought by
Cook Melanie
Home Financials for this Owner
Home Financials are based on the most recent Mortgage that was taken out on this home.
Original Mortgage
$136,900
Interest Rate
5.74%
Mortgage Type
Stand Alone Refi Refinance Of Original Loan
Purchase Details
Closed on
Oct 25, 2004
Sold by
Cook Melanie
Bought by
Cook James A
Home Financials for this Owner
Home Financials are based on the most recent Mortgage that was taken out on this home.
Original Mortgage
$136,900
Interest Rate
5.74%
Mortgage Type
Stand Alone Refi Refinance Of Original Loan
Create a Home Valuation Report for This Property
The Home Valuation Report is an in-depth analysis detailing your home's value as well as a comparison with similar homes in the area
Home Values in the Area
Average Home Value in this Area
Purchase History
| Date | Buyer | Sale Price | Title Company |
|---|---|---|---|
| Cook James A | -- | Land Title Company | |
| Cook Melanie | -- | -- | |
| Cook James A | -- | First American Title Ins |
Source: Public Records
Mortgage History
| Date | Status | Borrower | Loan Amount |
|---|---|---|---|
| Closed | Cook James A | $359,000 | |
| Closed | Cook James A | $309,600 | |
| Closed | Cook James A | $279,234 | |
| Closed | Cook James A | $278,393 | |
| Closed | Cook James A | $232,000 | |
| Closed | Cook James A | $200,000 | |
| Closed | Cook Melanie | $156,800 | |
| Closed | Cook James A | $163,000 | |
| Closed | Cook James A | $44,000 | |
| Closed | Cook James A | $39,250 | |
| Closed | Cook James A | $23,000 | |
| Closed | Cook James A | $136,900 |
Source: Public Records
Tax History Compared to Growth
Tax History
| Year | Tax Paid | Tax Assessment Tax Assessment Total Assessment is a certain percentage of the fair market value that is determined by local assessors to be the total taxable value of land and additions on the property. | Land | Improvement |
|---|---|---|---|---|
| 2025 | $623 | $369,100 | $94,710 | $274,390 |
| 2024 | $609 | $369,100 | $94,710 | $274,390 |
| 2023 | $580 | $369,100 | $94,710 | $274,390 |
| 2022 | $2,976 | $295,150 | $75,640 | $219,510 |
| 2021 | $2,745 | $257,260 | $65,770 | $191,490 |
| 2020 | $2,499 | $226,990 | $59,490 | $167,500 |
| 2019 | $2,153 | $214,640 | $56,240 | $158,400 |
| 2018 | $2,251 | $169,310 | $48,800 | $120,510 |
| 2017 | $1,872 | $169,310 | $48,800 | $120,510 |
| 2016 | $1,834 | $151,830 | $46,480 | $105,350 |
| 2015 | $1,773 | $148,800 | $46,480 | $102,320 |
| 2014 | -- | $145,190 | $47,870 | $97,320 |
| 2013 | -- | $145,190 | $47,870 | $97,320 |
Source: Public Records
Map
Nearby Homes
- 868 California Ave E
- 6909 SE Cleveland Ave
- 1420 Timber Trail Rd E
- 1237 Texas Place SE
- 1050 Woods Rd E
- 7847 SE Monte Bella Place
- 5 Lots Lilypad Place E
- 1690 Lilypad Place E
- 7775 SE Blakeview Dr
- 1568 Puget Dr E
- 8185 E Seaview Dr
- 1887 Salal St E
- 0 E Alder St
- 7680 SE Southworth Dr
- 5957 E Collins Rd
- 8129 E Cricket Ln
- 6551 SE Garfield St
- 1831 Miracle Mile Dr E
- 7751 E Main St Unit A6
- 1000 Hillandale Dr E
- 972 California Ave E
- 7176 E Polk Ave
- 956 California Ave E
- 7062 E Polk Ave
- 966 California Ave E
- 7182 E Polk Ave
- 952 California Ave E
- 7050 E Polk Ave
- 7074 E Polk Ave
- 7188 E Polk Ave
- 862 California Ave E
- 1020 Megan Ct E
- 7101 E Firefly Ct
- 7173 E Fillmore St
- 7194 E Polk Ave
- 1040 Megan Ct E
- 856 California Ave E
- 7195 E Polk Ave