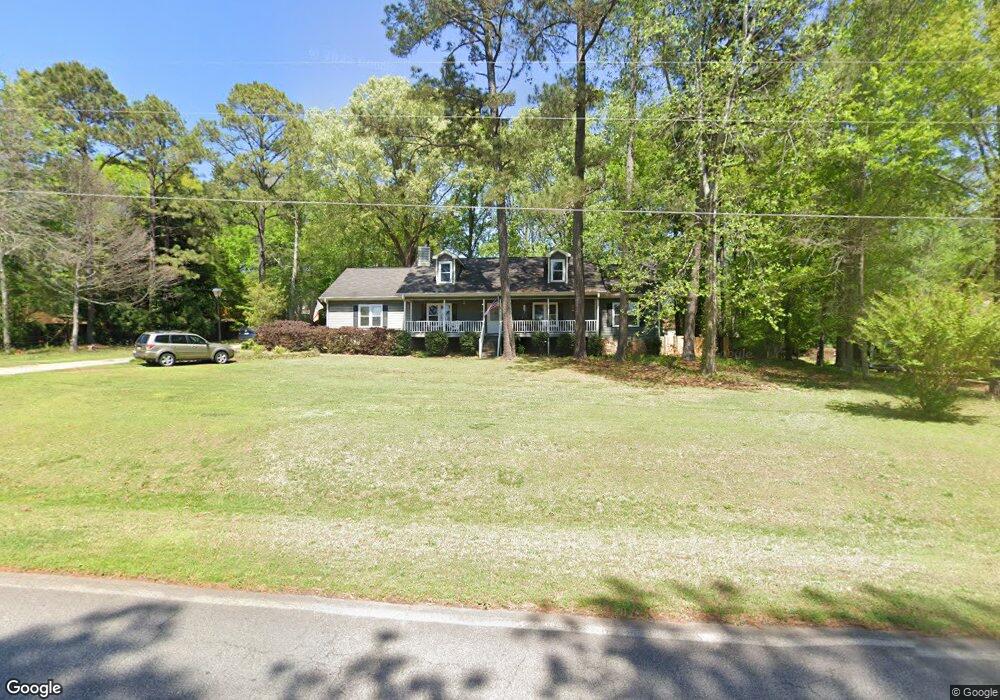
972 Moseley Rd Stockbridge, GA 30281
Estimated Value: $374,000 - $434,000
5
Beds
3
Baths
3,346
Sq Ft
$121/Sq Ft
Est. Value
About This Home
This home is located at 972 Moseley Rd, Stockbridge, GA 30281 and is currently estimated at $403,881, approximately $120 per square foot. 972 Moseley Rd is a home located in Henry County with nearby schools including Woodland Elementary School, Woodland Middle School, and Woodland High School.
Ownership History
Date
Name
Owned For
Owner Type
Purchase Details
Closed on
Nov 15, 2010
Sold by
Thomas Jason M
Bought by
Thomas Jason M and Thomas Chalise L
Current Estimated Value
Home Financials for this Owner
Home Financials are based on the most recent Mortgage that was taken out on this home.
Original Mortgage
$139,455
Outstanding Balance
$92,291
Interest Rate
4.33%
Mortgage Type
VA
Estimated Equity
$311,590
Purchase Details
Closed on
Dec 27, 2001
Sold by
Beisser Brian L
Bought by
Davis Keith and Davis Kristin
Home Financials for this Owner
Home Financials are based on the most recent Mortgage that was taken out on this home.
Original Mortgage
$123,400
Interest Rate
6.99%
Mortgage Type
New Conventional
Purchase Details
Closed on
Jun 14, 2000
Sold by
Beisser Angela C
Bought by
Beisser Brian L
Purchase Details
Closed on
Mar 31, 1995
Sold by
Cisneros Henry
Bought by
Beisser Brian Angela
Purchase Details
Closed on
Aug 2, 1994
Sold by
Bk Sou Mtg
Bought by
Hud
Create a Home Valuation Report for This Property
The Home Valuation Report is an in-depth analysis detailing your home's value as well as a comparison with similar homes in the area
Home Values in the Area
Average Home Value in this Area
Purchase History
| Date | Buyer | Sale Price | Title Company |
|---|---|---|---|
| Thomas Jason M | -- | -- | |
| Thomas Jason M | $135,000 | -- | |
| Davis Keith | $129,900 | -- | |
| Beisser Brian L | -- | -- | |
| Beisser Brian Angela | -- | -- | |
| Hud | -- | -- | |
| Bk South Mtg | $104,500 | -- |
Source: Public Records
Mortgage History
| Date | Status | Borrower | Loan Amount |
|---|---|---|---|
| Open | Thomas Jason M | $139,455 | |
| Previous Owner | Davis Keith | $123,400 |
Source: Public Records
Tax History Compared to Growth
Tax History
| Year | Tax Paid | Tax Assessment Tax Assessment Total Assessment is a certain percentage of the fair market value that is determined by local assessors to be the total taxable value of land and additions on the property. | Land | Improvement |
|---|---|---|---|---|
| 2025 | $4,216 | $150,796 | $14,000 | $136,796 |
| 2024 | $4,216 | $145,160 | $14,000 | $131,160 |
| 2023 | $3,431 | $133,800 | $10,800 | $123,000 |
| 2022 | $3,238 | $104,240 | $10,800 | $93,440 |
| 2021 | $2,917 | $90,640 | $10,800 | $79,840 |
| 2020 | $2,871 | $88,680 | $10,800 | $77,880 |
| 2019 | $2,733 | $82,840 | $10,800 | $72,040 |
| 2018 | $2,587 | $76,680 | $10,000 | $66,680 |
| 2016 | $2,483 | $72,240 | $8,000 | $64,240 |
| 2015 | $1,909 | $54,560 | $7,200 | $47,360 |
| 2014 | $1,876 | $53,240 | $6,000 | $47,240 |
Source: Public Records
Map
Nearby Homes
- 1009 Moseley Rd
- 1001 Moseley Rd
- 1493 Harlequin Way
- 825 Bufflehead Ct
- 245 Moseley Crossing Dr Unit 3
- 1548 Harlequin Way
- 100 Kim Trail
- 405 Tatum Terrace
- 116 Way Point Dr
- 651 Whitman Ln
- 644 Whitman Ln
- 647 Whitman Ln
- 640 Whitman Ln
- 643 Whitman Ln
- 1111 Hemphill Rd
- 639 Whitman Ln
- 400 Moseley Rd
- 632 Whitman Ln
- 960 Moseley Rd Unit 3
- 980 Moseley Rd
- 20 Bennington Ct
- 100 Bennington Dr
- 940 Moseley Rd Unit 3
- 30 Bennington Ct
- 95 Bennington Dr Unit 1
- 105 Bennington Dr
- 40 Bennington Ct
- 0 Bennington Ct Unit 8384361
- 0 Bennington Ct Unit 8749999
- 859 Moseley Rd
- 920 Moseley Rd
- 25 Bennington Ct
- 115 Bennington Dr
- 1446 Harlequin Way Unit 1047
- 1446 Harlequin Way
- 1446 Harlequin Way Unit 47
- 140 Bennington Dr
- 35 Bennington Ct