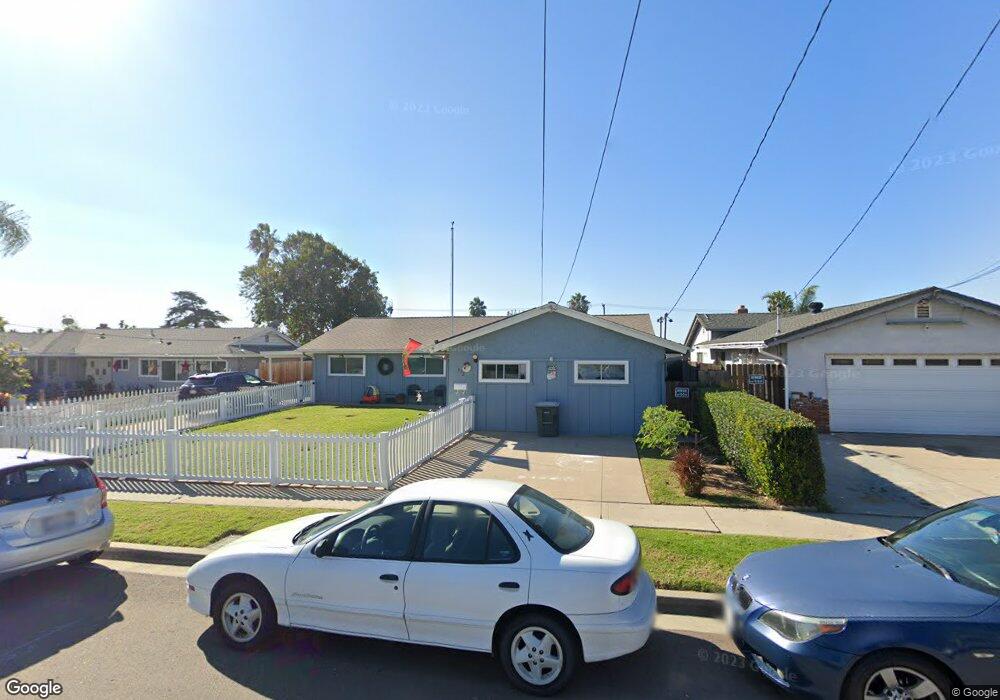
972 Myra Ave Chula Vista, CA 91911
Castle Park NeighborhoodEstimated Value: $845,000 - $873,873
4
Beds
3
Baths
1,990
Sq Ft
$430/Sq Ft
Est. Value
About This Home
This home is located at 972 Myra Ave, Chula Vista, CA 91911 and is currently estimated at $855,968, approximately $430 per square foot. 972 Myra Ave is a home located in San Diego County with nearby schools including Karl H Kellogg Elementary School, Hilltop Middle School, and Hilltop Senior High School.
Ownership History
Date
Name
Owned For
Owner Type
Purchase Details
Closed on
Mar 8, 2021
Sold by
Trembley Michelle and Trembley Michelle I
Bought by
Trembley Richard A and Trembley Michelle
Current Estimated Value
Purchase Details
Closed on
May 15, 2019
Sold by
Royer Cynthia R and Rs Lindsey Family Trust
Bought by
Royer Cynthia R and Trembley Michelle I
Purchase Details
Closed on
Feb 1, 2002
Sold by
Lindsey Shirley C
Bought by
Lindsey Shirley C
Create a Home Valuation Report for This Property
The Home Valuation Report is an in-depth analysis detailing your home's value as well as a comparison with similar homes in the area
Home Values in the Area
Average Home Value in this Area
Purchase History
| Date | Buyer | Sale Price | Title Company |
|---|---|---|---|
| Trembley Richard A | -- | None Available | |
| Royer Cynthia R | -- | None Available | |
| Lindsey Shirley C | -- | -- |
Source: Public Records
Tax History
| Year | Tax Paid | Tax Assessment Tax Assessment Total Assessment is a certain percentage of the fair market value that is determined by local assessors to be the total taxable value of land and additions on the property. | Land | Improvement |
|---|---|---|---|---|
| 2025 | $1,271 | $115,058 | $21,451 | $93,607 |
| 2024 | $1,271 | $112,803 | $21,031 | $91,772 |
| 2023 | $1,251 | $110,592 | $20,619 | $89,973 |
| 2022 | $1,214 | $108,424 | $20,215 | $88,209 |
| 2021 | $1,185 | $106,299 | $19,819 | $86,480 |
| 2020 | $1,156 | $105,210 | $19,616 | $85,594 |
| 2019 | $1,126 | $103,148 | $19,232 | $83,916 |
| 2018 | $1,107 | $101,126 | $18,855 | $82,271 |
| 2017 | $1,082 | $99,144 | $18,486 | $80,658 |
| 2016 | $1,054 | $97,201 | $18,124 | $79,077 |
| 2015 | $1,038 | $95,742 | $17,852 | $77,890 |
| 2014 | $1,021 | $93,868 | $17,503 | $76,365 |
Source: Public Records
Map
Nearby Homes
- 953 Maria Way
- 158 E L St
- 902 Monterey Ct
- 1017 Helix Ave
- 1027 Guatay Ave
- 376 Roman Way
- 232 E Naples St
- 1054 Cuyamaca Ave
- 927 Agua Tibia Ave
- 859 Tamayo Dr Unit 2
- 75 E Naples St
- 814 Tamayo Dr Unit 2
- 202 E J St
- 445 Montcalm St
- 476 Montclair St
- 1267 Melrose Ave
- 838 David Dr
- 1268 Helix Ave
- 112 Country Club Dr
- 586 88 Roosevelt St
Your Personal Tour Guide
Ask me questions while you tour the home.