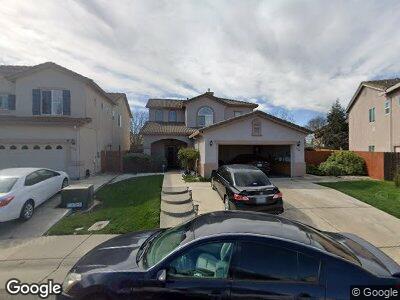
9728 Wild Teak Ct Elk Grove, CA 95757
South West Elk Grove NeighborhoodEstimated Value: $648,000 - $721,000
4
Beds
3
Baths
1,874
Sq Ft
$358/Sq Ft
Est. Value
About This Home
This home is located at 9728 Wild Teak Ct, Elk Grove, CA 95757 and is currently estimated at $671,821, approximately $358 per square foot. 9728 Wild Teak Ct is a home located in Sacramento County with nearby schools including Arlene Hein Elementary School, Toby Johnson Middle School, and Franklin High School.
Ownership History
Date
Name
Owned For
Owner Type
Purchase Details
Closed on
Feb 23, 2022
Sold by
Singh and Nazra
Bought by
Singh Ranjesh
Current Estimated Value
Home Financials for this Owner
Home Financials are based on the most recent Mortgage that was taken out on this home.
Original Mortgage
$369,000
Outstanding Balance
$305,774
Interest Rate
2.93%
Mortgage Type
New Conventional
Estimated Equity
$363,441
Purchase Details
Closed on
Sep 6, 2011
Sold by
Mtc Financial Inc
Bought by
Singh Ranjesh and Bibi Nazra
Purchase Details
Closed on
Aug 9, 2011
Sold by
Singh Ranjesh and Bibi Nazra
Bought by
Golden 1 Credit Union
Purchase Details
Closed on
Jun 23, 2005
Sold by
Cresleigh Homes Corp
Bought by
Singh Ranjesh and Bibi Nazra
Home Financials for this Owner
Home Financials are based on the most recent Mortgage that was taken out on this home.
Original Mortgage
$384,350
Interest Rate
4.75%
Mortgage Type
Purchase Money Mortgage
Create a Home Valuation Report for This Property
The Home Valuation Report is an in-depth analysis detailing your home's value as well as a comparison with similar homes in the area
Home Values in the Area
Average Home Value in this Area
Purchase History
| Date | Buyer | Sale Price | Title Company |
|---|---|---|---|
| Singh Ranjesh | $122,000 | American Coast Title | |
| Singh Ranjesh | -- | None Available | |
| Golden 1 Credit Union | $406,896 | Accommodation | |
| Singh Ranjesh | $427,500 | First American Title Company |
Source: Public Records
Mortgage History
| Date | Status | Borrower | Loan Amount |
|---|---|---|---|
| Open | Singh Ranjesh | $369,000 | |
| Previous Owner | Singh Ranjesh | $359,250 | |
| Previous Owner | Singh Ranjesh | $100,000 | |
| Previous Owner | Singh Ranjesh | $384,350 |
Source: Public Records
Tax History Compared to Growth
Tax History
| Year | Tax Paid | Tax Assessment Tax Assessment Total Assessment is a certain percentage of the fair market value that is determined by local assessors to be the total taxable value of land and additions on the property. | Land | Improvement |
|---|---|---|---|---|
| 2024 | $7,684 | $584,199 | $122,984 | $461,215 |
| 2023 | $7,508 | $572,745 | $120,573 | $452,172 |
| 2022 | $7,377 | $561,515 | $118,209 | $443,306 |
| 2021 | $7,276 | $550,506 | $115,892 | $434,614 |
| 2020 | $6,559 | $485,566 | $102,220 | $383,346 |
| 2019 | $6,307 | $462,445 | $97,353 | $365,092 |
| 2018 | $6,114 | $448,977 | $94,518 | $354,459 |
| 2017 | $5,763 | $415,720 | $87,517 | $328,203 |
| 2016 | $5,442 | $399,731 | $84,151 | $315,580 |
| 2015 | $5,121 | $370,122 | $77,918 | $292,204 |
| 2014 | $5,018 | $359,342 | $75,649 | $283,693 |
Source: Public Records
Map
Nearby Homes
- 9559 Jaguar Ct
- 6000 Livorno Way
- 9640 Country Falls Ln
- 9615 Red Current Way
- 5409 Friesian Way
- 5300 Tersk Way
- 6616 Pallazzo Way
- 9701 Mckenna Dr
- 9909 Blue Lupine Place
- 9608 Golf Course Ln
- 5714 Fire Poppy Dr
- 6600 Caprezzo Way
- 5044 Brabant Ct
- 9476 Queensbury Ct
- 9837 Valgrande Way
- 5418 Tares Cir Unit 5418
- 8919 Haflinger Way
- 10061 Mosaic Way
- 4700 Coppola Cir
- 5537 Tares Cir
- 9728 Wild Teak Ct
- 9724 Wild Teak Ct
- 9732 Wild Teak Ct
- 9729 Summer Glen Way
- 9733 Summer Glen Way
- 9720 Wild Teak Ct
- 9725 Summer Glen Way
- 9729 Wild Teak Ct
- 9737 Summer Glen Way
- 9721 Summer Glen Way
- 9725 Wild Teak Ct
- 9716 Wild Teak Ct
- 9721 Wild Teak Ct
- 5815 Jared Ct
- 5811 Jared Ct
- 9741 Summer Glen Way
- 5819 Jared Ct
- 9717 Wild Teak Ct
- 9717 Summer Glen Way
- 9724 Cariann Ct