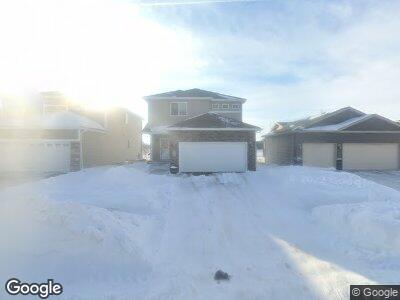
973 31st Ave W West Fargo, ND 58078
Eaglewood NeighborhoodEstimated Value: $335,000 - $391,966
4
Beds
3
Baths
2,933
Sq Ft
$124/Sq Ft
Est. Value
About This Home
This home is located at 973 31st Ave W, West Fargo, ND 58078 and is currently estimated at $363,483, approximately $123 per square foot. 973 31st Ave W is a home located in Cass County with nearby schools including Brooks Harbor Elementary School, Liberty Middle School, and West Fargo Sheyenne High School.
Ownership History
Date
Name
Owned For
Owner Type
Purchase Details
Closed on
Nov 6, 2019
Sold by
Miller Nathan
Bought by
Olsen Sabrina C and Olsen John P
Current Estimated Value
Home Financials for this Owner
Home Financials are based on the most recent Mortgage that was taken out on this home.
Original Mortgage
$257,254
Interest Rate
3.62%
Mortgage Type
FHA
Purchase Details
Closed on
Aug 11, 2014
Sold by
Thomsen Homes Llc
Bought by
Miller Nathan and Miller Carrie
Home Financials for this Owner
Home Financials are based on the most recent Mortgage that was taken out on this home.
Original Mortgage
$239,621
Interest Rate
4.37%
Mortgage Type
FHA
Purchase Details
Closed on
Oct 10, 2013
Sold by
Westwood Development Llc
Bought by
Thomsen Homes Llc
Create a Home Valuation Report for This Property
The Home Valuation Report is an in-depth analysis detailing your home's value as well as a comparison with similar homes in the area
Home Values in the Area
Average Home Value in this Area
Purchase History
| Date | Buyer | Sale Price | Title Company |
|---|---|---|---|
| Olsen Sabrina C | $262,000 | Title Co | |
| Miller Nathan | -- | None Available | |
| Thomsen Homes Llc | -- | None Available |
Source: Public Records
Mortgage History
| Date | Status | Borrower | Loan Amount |
|---|---|---|---|
| Open | Olsen Sabrina C | $293,040 | |
| Closed | Olsen Sabrina C | $256,557 | |
| Closed | Olsen Sabrina C | $257,254 | |
| Previous Owner | Miller Carrie | $242,724 | |
| Previous Owner | Miller Nathan | $239,621 | |
| Previous Owner | Thomsen Homes Llc | $139,112 |
Source: Public Records
Tax History Compared to Growth
Tax History
| Year | Tax Paid | Tax Assessment Tax Assessment Total Assessment is a certain percentage of the fair market value that is determined by local assessors to be the total taxable value of land and additions on the property. | Land | Improvement |
|---|---|---|---|---|
| 2024 | $5,700 | $176,000 | $20,000 | $156,000 |
| 2023 | $5,911 | $163,400 | $20,000 | $143,400 |
| 2022 | $5,586 | $148,100 | $20,000 | $128,100 |
| 2021 | $5,451 | $141,100 | $18,000 | $123,100 |
| 2020 | $5,388 | $140,650 | $18,000 | $122,650 |
| 2019 | $5,729 | $150,800 | $18,000 | $132,800 |
| 2018 | $5,613 | $149,450 | $18,000 | $131,450 |
| 2017 | $5,385 | $145,450 | $18,000 | $127,450 |
| 2016 | $3,059 | $63,500 | $18,000 | $45,500 |
| 2015 | $2,735 | $46,400 | $8,250 | $38,150 |
| 2014 | $3,824 | $86,200 | $8,250 | $77,950 |
| 2013 | $1,805 | $4,450 | $4,450 | $0 |
Source: Public Records
Map
Nearby Homes
- 973 31st Ave W
- 969 31st Ave W
- 1011 31st Ave W
- 965 31st Ave W
- 1017 31st Ave W
- 961 31st Ave W
- 1010 31st Ave W
- 957 31st Ave W
- 1023 31st Ave W
- 966 31st Ave W
- 970 31st Ave W
- 953 31st Ave W
- 962 31st Ave W
- 1014 31st Ave W
- 958 31st Ave W
- 1018 31st Ave W
- 1029 31st Ave W
- 949 31st Ave W
- 1022 31st Ave W
- 954 31st Ave W