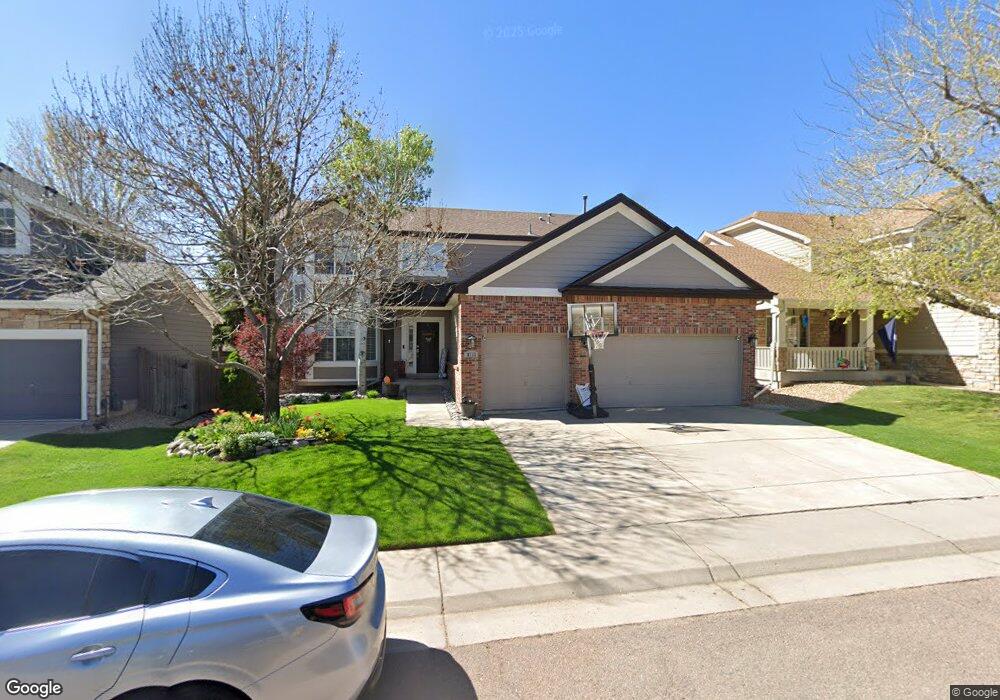
9732 W Unser Ave Littleton, CO 80128
Chatfield Bluffs NeighborhoodEstimated Value: $722,940 - $779,000
3
Beds
5
Baths
2,263
Sq Ft
$330/Sq Ft
Est. Value
About This Home
This home is located at 9732 W Unser Ave, Littleton, CO 80128 and is currently estimated at $746,485, approximately $329 per square foot. 9732 W Unser Ave is a home located in Jefferson County with nearby schools including Shaffer Elementary School, Falcon Bluffs Middle School, and Chatfield High School.
Ownership History
Date
Name
Owned For
Owner Type
Purchase Details
Closed on
Jul 13, 2005
Sold by
Bohlen Julie L
Bought by
Lynn David W and Lynn Katherine E
Current Estimated Value
Home Financials for this Owner
Home Financials are based on the most recent Mortgage that was taken out on this home.
Original Mortgage
$293,920
Outstanding Balance
$152,636
Interest Rate
5.58%
Mortgage Type
Fannie Mae Freddie Mac
Estimated Equity
$593,849
Purchase Details
Closed on
Nov 24, 1999
Sold by
Annette Leone Gina Elisa Leone
Bought by
Bohlen Julie L
Home Financials for this Owner
Home Financials are based on the most recent Mortgage that was taken out on this home.
Original Mortgage
$214,400
Interest Rate
7.75%
Purchase Details
Closed on
Jun 22, 1998
Sold by
The Ryland Group Inc
Bought by
Leone Gina Elisa and Leone Annette
Home Financials for this Owner
Home Financials are based on the most recent Mortgage that was taken out on this home.
Original Mortgage
$118,690
Interest Rate
7.21%
Create a Home Valuation Report for This Property
The Home Valuation Report is an in-depth analysis detailing your home's value as well as a comparison with similar homes in the area
Home Values in the Area
Average Home Value in this Area
Purchase History
| Date | Buyer | Sale Price | Title Company |
|---|---|---|---|
| Lynn David W | $367,400 | Stewart Title Of Denver | |
| Bohlen Julie L | $268,000 | -- | |
| Leone Gina Elisa | $228,690 | -- |
Source: Public Records
Mortgage History
| Date | Status | Borrower | Loan Amount |
|---|---|---|---|
| Open | Lynn David W | $293,920 | |
| Previous Owner | Bohlen Julie L | $214,400 | |
| Previous Owner | Leone Gina Elisa | $118,690 |
Source: Public Records
Tax History Compared to Growth
Tax History
| Year | Tax Paid | Tax Assessment Tax Assessment Total Assessment is a certain percentage of the fair market value that is determined by local assessors to be the total taxable value of land and additions on the property. | Land | Improvement |
|---|---|---|---|---|
| 2024 | $3,847 | $45,975 | $11,482 | $34,493 |
| 2023 | $3,847 | $45,975 | $11,482 | $34,493 |
| 2022 | $4,029 | $40,389 | $10,204 | $30,185 |
| 2021 | $4,080 | $41,551 | $10,498 | $31,053 |
| 2020 | $3,612 | $36,864 | $7,947 | $28,917 |
| 2019 | $3,567 | $36,864 | $7,947 | $28,917 |
| 2018 | $3,437 | $34,308 | $9,020 | $25,288 |
| 2017 | $3,138 | $34,308 | $9,020 | $25,288 |
| 2016 | $3,040 | $32,070 | $8,429 | $23,641 |
| 2015 | $2,628 | $32,070 | $8,429 | $23,641 |
| 2014 | $2,628 | $26,001 | $6,809 | $19,192 |
Source: Public Records
Map
Nearby Homes
- 8808 S Kipling Way Unit 202
- 8778 S Kipling Way Unit 108
- 8778 S Kipling Way Unit 304
- 8778 S Kipling Way Unit 303
- 8726 S Kline St Unit A208
- 10056 W Unser Dr Unit 204
- 8779 S Kipling Way Unit 105
- 9962 W Victoria Place Unit 102
- 9367 W Vandeventor Dr
- 10061 W Victoria Place Unit 204
- 9992 W Victoria Place Unit 103
- 10062 W Victoria Place Unit 205
- 9557 W San Juan Cir Unit 207
- 8582 S Lewis Way
- 8338 S Independence Cir Unit 104
- 8338 S Independence Cir Unit 107
- 8603 S Lewis Way
- 8369 S Independence Cir Unit 305
- 8835 W Teton Cir
- 8309 S Independence Cir Unit 203
- 9712 W Unser Ave
- 9752 W Unser Ave
- 9707 W Vandeventor Dr
- 9682 W Unser Ave
- 9727 W Vandeventor Dr
- 9772 W Unser Ave
- 9697 W Vandeventor Dr
- 9747 W Vandeventor Dr
- 9657 W Vandeventor Dr
- 9662 W Unser Ave
- 9731 W Unser Ave
- 9711 W Unser Ave
- 9751 W Unser Ave
- 9681 W Unser Ave
- 9637 W Vandeventor Dr
- 9761 W Unser Ave
- 9671 W Unser Ave
- 9767 W Vandeventor Dr
- 9812 W Unser Ave
- 9642 W Unser Ave