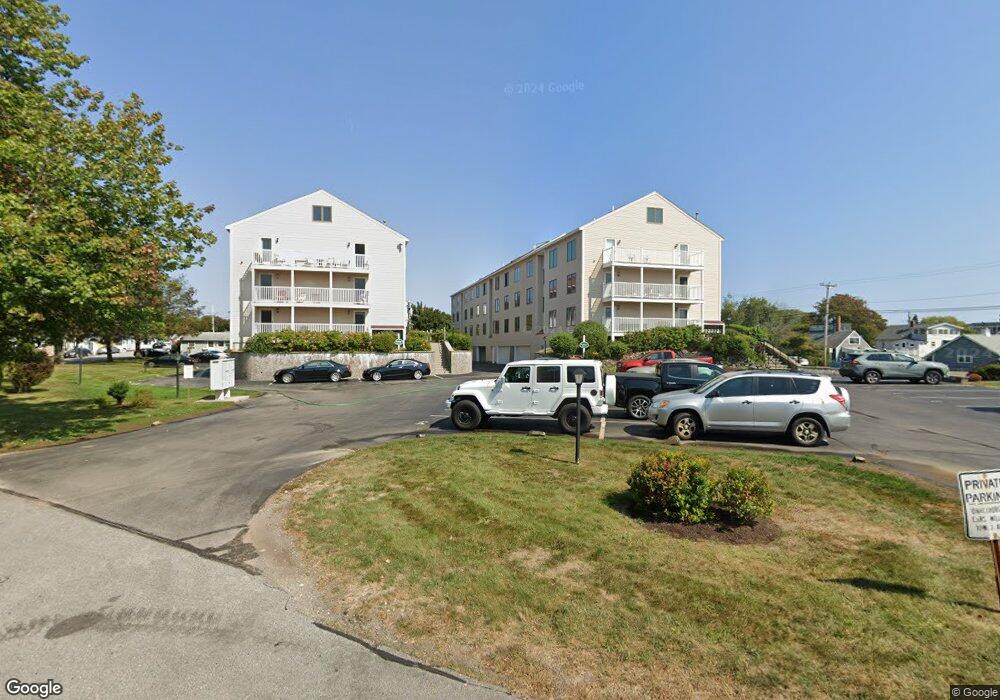
975 Ocean Blvd Unit 8 Hampton, NH 03842
Estimated Value: $438,553 - $671,000
2
Beds
2
Baths
920
Sq Ft
$574/Sq Ft
Est. Value
About This Home
This home is located at 975 Ocean Blvd Unit 8, Hampton, NH 03842 and is currently estimated at $528,138, approximately $574 per square foot. 975 Ocean Blvd Unit 8 is a home located in Rockingham County with nearby schools including Hampton Centre School, Adeline C. Marston Elementary School, and Hampton Academy.
Ownership History
Date
Name
Owned For
Owner Type
Purchase Details
Closed on
Oct 19, 2009
Sold by
Neve Aileen R and Neve Thomas E
Bought by
Shubert James C and Shubert Cheryl J
Current Estimated Value
Home Financials for this Owner
Home Financials are based on the most recent Mortgage that was taken out on this home.
Original Mortgage
$150,000
Outstanding Balance
$96,648
Interest Rate
5.14%
Mortgage Type
Purchase Money Mortgage
Estimated Equity
$431,490
Purchase Details
Closed on
Apr 28, 1999
Sold by
Maguire John J and Maguire Janet M
Bought by
Neve Aileen R and Neve Thomas E
Purchase Details
Closed on
Dec 11, 1996
Sold by
Monoxelos Milton and Monoxelos Catherine
Bought by
Higgins Laurence O and Higgins Karen J
Home Financials for this Owner
Home Financials are based on the most recent Mortgage that was taken out on this home.
Original Mortgage
$37,000
Interest Rate
7.75%
Create a Home Valuation Report for This Property
The Home Valuation Report is an in-depth analysis detailing your home's value as well as a comparison with similar homes in the area
Home Values in the Area
Average Home Value in this Area
Purchase History
| Date | Buyer | Sale Price | Title Company |
|---|---|---|---|
| Shubert James C | $247,000 | -- | |
| Neve Aileen R | $141,000 | -- | |
| Higgins Laurence O | $112,000 | -- |
Source: Public Records
Mortgage History
| Date | Status | Borrower | Loan Amount |
|---|---|---|---|
| Open | Higgins Laurence O | $100,000 | |
| Open | Higgins Laurence O | $150,000 | |
| Previous Owner | Higgins Laurence O | $37,000 |
Source: Public Records
Tax History
| Year | Tax Paid | Tax Assessment Tax Assessment Total Assessment is a certain percentage of the fair market value that is determined by local assessors to be the total taxable value of land and additions on the property. | Land | Improvement |
|---|---|---|---|---|
| 2025 | $5,099 | $413,900 | $0 | $413,900 |
| 2024 | $5,099 | $413,900 | $0 | $413,900 |
| 2023 | $4,970 | $296,700 | $0 | $296,700 |
| 2022 | $4,700 | $296,700 | $0 | $296,700 |
| 2021 | $4,700 | $296,700 | $0 | $296,700 |
| 2020 | $4,726 | $296,700 | $0 | $296,700 |
| 2019 | $4,750 | $296,700 | $0 | $296,700 |
| 2018 | $4,282 | $251,600 | $0 | $251,600 |
| 2017 | $4,119 | $251,600 | $0 | $251,600 |
| 2016 | $4,046 | $251,600 | $0 | $251,600 |
| 2015 | $3,935 | $205,400 | $0 | $205,400 |
| 2014 | $3,761 | $205,400 | $0 | $205,400 |
Source: Public Records
Map
Nearby Homes
- 61 Acorn Rd
- 989 Ocean Blvd Unit 8
- 12 Smith Ave
- 933 Ocean Blvd Unit 11
- 190 Kings Hwy Unit A1
- 5 Ocean Blvd
- 467 High St Unit 11
- 467 High St Unit 10
- 4 Hutchinson Dr
- 68 Kings Hwy Unit 27
- 93 Dunvegan Woods
- 12 Runnymede Dr
- 11 Redman St
- 28 Dunvegan Woods
- 8 Dunvegan Woods
- 550 Winnacunnet Rd Unit 219
- 37 Alexander Dr
- 29 Thorwald Ave
- 580 Winnacunnet Rd Unit 205
- 543 Winnacunnet Rd
- 975 Ocean Blvd Unit 9
- 975 Ocean Blvd Unit 7
- 975 Ocean Blvd Unit 6
- 975 Ocean Blvd Unit 5
- 975 Ocean Blvd Unit 30
- 975 Ocean Blvd Unit 3
- 975 Ocean Blvd Unit 29
- 975 Ocean Blvd Unit 28
- 975 Ocean Blvd Unit 27
- 975 Ocean Blvd Unit 26
- 975 Ocean Blvd Unit 25
- 975 Ocean Blvd Unit 24
- 975 Ocean Blvd Unit 23
- 975 Ocean Blvd Unit 21
- 975 Ocean Blvd Unit 20
- 975 Ocean Blvd Unit 2
- 975 Ocean Blvd Unit 19
- 975 Ocean Blvd Unit 18
- 975 Ocean Blvd Unit 17
- 975 Ocean Blvd Unit 16
Your Personal Tour Guide
Ask me questions while you tour the home.