D
Seller's Agent in 2013
David Walker
RE/MAX
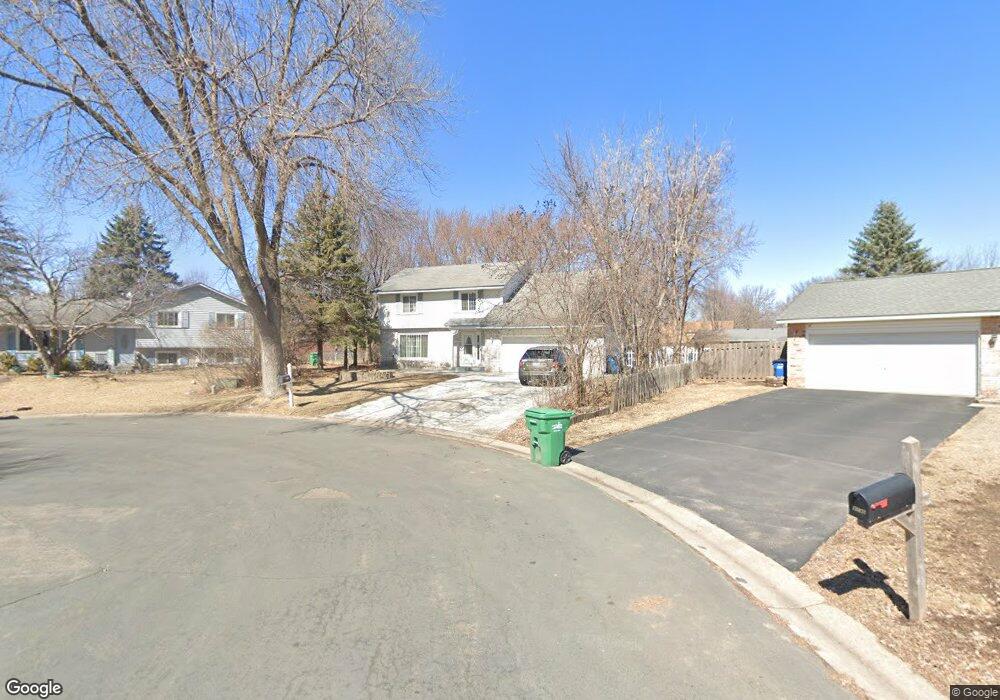
Estimated Value: $387,000 - $463,000
Great 3 Bedroom, 3 Bath, 2 Story with Large Backyard. Close to Parks and Trails. Formal and Informal Dining Rooms. Lower partially finished, needs carpet. Agent/Buyer to verify all information and measurements.
| Date | Buyer | Sale Price | Title Company |
|---|---|---|---|
| 2015-3 Ih2 Borrower Lp | -- | None Available | |
| -- | $199,900 | -- | |
| Ih2 Property Illinois Lp | -- | First Financial Title Agency | |
| Onewest Bank Fsb | $232,048 | -- | |
| Onewest Bank Fsb | $232,047 | None Available | |
| Vylasek Jason J | $281,000 | -- |
| Date | Status | Borrower | Loan Amount |
|---|---|---|---|
| Previous Owner | 2015-3 Ih2 Borrower Lp | $1,193,950 | |
| Closed | Vylasek Jason J | -- |
| Date | Event | Price | List to Sale | Price per Sq Ft | Prior Sale |
|---|---|---|---|---|---|
| 08/29/2013 08/29/13 | Sold | $199,856 | -21.9% | $80 / Sq Ft | View Prior Sale |
| 08/13/2013 08/13/13 | Pending | -- | -- | -- | |
| 06/12/2013 06/12/13 | For Sale | $255,900 | -- | $103 / Sq Ft |
| Year | Tax Paid | Tax Assessment Tax Assessment Total Assessment is a certain percentage of the fair market value that is determined by local assessors to be the total taxable value of land and additions on the property. | Land | Improvement |
|---|---|---|---|---|
| 2024 | $5,319 | $415,000 | $127,300 | $287,700 |
| 2023 | $4,976 | $401,100 | $118,800 | $282,300 |
| 2022 | $4,170 | $397,500 | $108,800 | $288,700 |
| 2021 | $3,991 | $321,200 | $81,100 | $240,100 |
| 2020 | $4,013 | $301,300 | $67,300 | $234,000 |
| 2019 | $4,147 | $287,800 | $65,700 | $222,100 |
| 2018 | $3,914 | $263,700 | $55,400 | $208,300 |
| 2017 | $3,917 | $248,900 | $56,000 | $192,900 |
| 2016 | $3,877 | $242,700 | $55,000 | $187,700 |
| 2015 | $3,734 | $226,700 | $41,000 | $185,700 |
| 2014 | -- | $215,300 | $49,600 | $165,700 |
D
Seller's Agent in 2013
David Walker
RE/MAX
C
Buyer's Agent in 2013
Craig Murphy
EPIC Realty, Inc