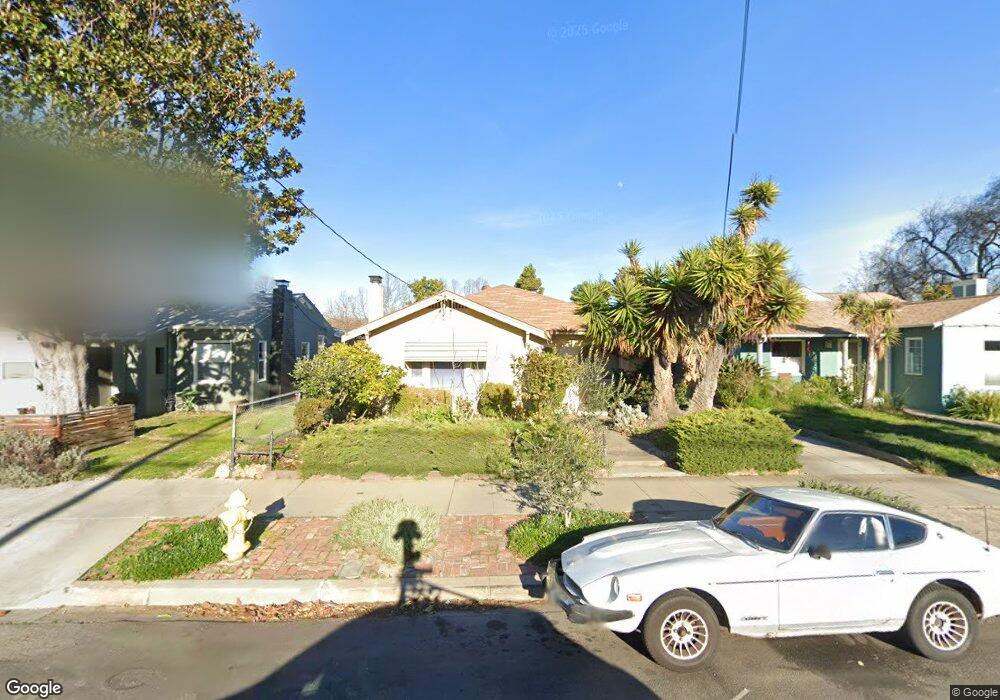
976 S 8th St San Jose, CA 95112
Spartan-Keyes NeighborhoodEstimated Value: $1,111,000 - $1,267,000
2
Beds
1
Bath
1,528
Sq Ft
$781/Sq Ft
Est. Value
About This Home
This home is located at 976 S 8th St, San Jose, CA 95112 and is currently estimated at $1,193,275, approximately $780 per square foot. 976 S 8th St is a home located in Santa Clara County with nearby schools including Lowell Elementary School, Herbert Hoover Middle School, and Abraham Lincoln High.
Ownership History
Date
Name
Owned For
Owner Type
Purchase Details
Closed on
Nov 10, 2021
Sold by
Nguyen Elisabeth Johansen and Nguyen Franklin T
Bought by
Nguyen Elisabeth Johansen and Nguyen Franklin T
Current Estimated Value
Purchase Details
Closed on
Aug 22, 2007
Sold by
Rendon Brenda L
Bought by
Nguyen Elisabeth J and Nguyen Franklin T
Home Financials for this Owner
Home Financials are based on the most recent Mortgage that was taken out on this home.
Original Mortgage
$417,000
Outstanding Balance
$265,101
Interest Rate
6.74%
Mortgage Type
Purchase Money Mortgage
Estimated Equity
$928,174
Purchase Details
Closed on
Oct 4, 2004
Sold by
Larson Wilma G and The Larson Family Trust
Bought by
Rendon Brenda L
Home Financials for this Owner
Home Financials are based on the most recent Mortgage that was taken out on this home.
Original Mortgage
$310,000
Interest Rate
4.5%
Mortgage Type
Purchase Money Mortgage
Purchase Details
Closed on
Mar 15, 1994
Sold by
Larson Kenneth E and Larson Wilma G
Bought by
Larson Kenneth E and Larson Wilma G
Create a Home Valuation Report for This Property
The Home Valuation Report is an in-depth analysis detailing your home's value as well as a comparison with similar homes in the area
Home Values in the Area
Average Home Value in this Area
Purchase History
| Date | Buyer | Sale Price | Title Company |
|---|---|---|---|
| Nguyen Elisabeth Johansen | -- | Chicago Title Company | |
| Nguyen Elisabeth J | $581,000 | Chicago Title Company | |
| Rendon Brenda L | $490,000 | -- | |
| Larson Kenneth E | -- | -- |
Source: Public Records
Mortgage History
| Date | Status | Borrower | Loan Amount |
|---|---|---|---|
| Open | Nguyen Elisabeth J | $417,000 | |
| Previous Owner | Rendon Brenda L | $310,000 |
Source: Public Records
Tax History Compared to Growth
Tax History
| Year | Tax Paid | Tax Assessment Tax Assessment Total Assessment is a certain percentage of the fair market value that is determined by local assessors to be the total taxable value of land and additions on the property. | Land | Improvement |
|---|---|---|---|---|
| 2025 | $10,101 | $763,140 | $534,200 | $228,940 |
| 2024 | $10,101 | $748,177 | $523,726 | $224,451 |
| 2023 | $9,897 | $733,507 | $513,457 | $220,050 |
| 2022 | $9,884 | $719,126 | $503,390 | $215,736 |
| 2021 | $9,587 | $705,026 | $493,520 | $211,506 |
| 2020 | $9,360 | $697,798 | $488,460 | $209,338 |
| 2019 | $9,152 | $684,117 | $478,883 | $205,234 |
| 2018 | $9,055 | $670,704 | $469,494 | $201,210 |
| 2017 | $8,977 | $657,554 | $460,289 | $197,265 |
| 2016 | $8,800 | $644,662 | $451,264 | $193,398 |
| 2015 | $8,738 | $634,979 | $444,486 | $190,493 |
| 2014 | $8,285 | $622,542 | $435,780 | $186,762 |
Source: Public Records
Map
Nearby Homes
- 961 S 7th St
- 327 Martha St
- 962 S 10th St
- 1144 S 9th St
- 1192 S 9th St
- 952 S 11th St Unit 234
- 516 Martha St Unit 101
- 516 Martha St Unit 201
- 951 S 12th St Unit 102
- 1060 S 3rd St Unit 129
- 1060 S 3rd St Unit 216
- 1060 S 3rd St Unit 379
- 1060 S 3rd St Unit 179
- 1060 S 3rd St Unit 344
- 1060 S 3rd St Unit 233
- 125 Patterson St Unit 334
- 125 Patterson St Unit 121
- 648 Valley Oak Terrace
- 674 S 5th St
- 114 Hollywood Ave