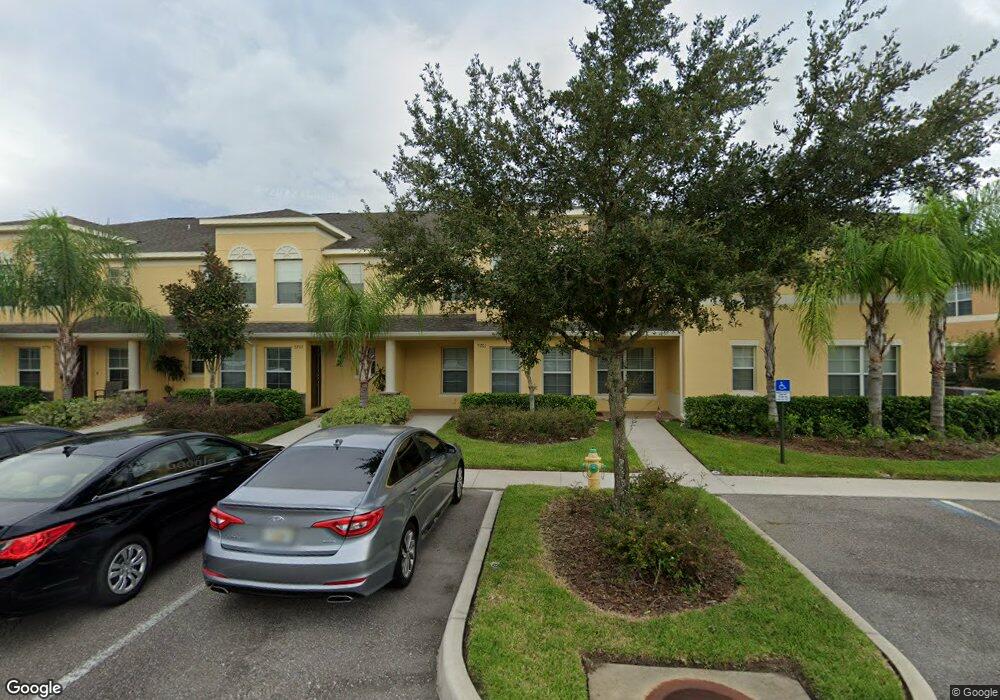
9761 Trumpet Vine Loop Trinity, FL 34655
Estimated Value: $248,000 - $307,000
2
Beds
3
Baths
1,630
Sq Ft
$171/Sq Ft
Est. Value
About This Home
This home is located at 9761 Trumpet Vine Loop, Trinity, FL 34655 and is currently estimated at $278,275, approximately $170 per square foot. 9761 Trumpet Vine Loop is a home located in Pasco County with nearby schools including Trinity Elementary School, Seven Springs Middle School, and James W. Mitchell High School.
Ownership History
Date
Name
Owned For
Owner Type
Purchase Details
Closed on
Jun 6, 2016
Sold by
Sutton Tamica and Shillingford Tamica
Bought by
Brand Christopher
Current Estimated Value
Home Financials for this Owner
Home Financials are based on the most recent Mortgage that was taken out on this home.
Original Mortgage
$145,350
Outstanding Balance
$114,814
Interest Rate
3.59%
Mortgage Type
New Conventional
Estimated Equity
$163,461
Purchase Details
Closed on
Jun 27, 2013
Sold by
Lennar Homes Llc
Bought by
Shilingford Tamica
Home Financials for this Owner
Home Financials are based on the most recent Mortgage that was taken out on this home.
Original Mortgage
$142,490
Interest Rate
3.59%
Mortgage Type
New Conventional
Purchase Details
Closed on
Jun 28, 2012
Sold by
Belmar Development Inc
Bought by
Lennar Homes Llc
Home Financials for this Owner
Home Financials are based on the most recent Mortgage that was taken out on this home.
Original Mortgage
$462,697
Interest Rate
3.83%
Mortgage Type
Seller Take Back
Create a Home Valuation Report for This Property
The Home Valuation Report is an in-depth analysis detailing your home's value as well as a comparison with similar homes in the area
Home Values in the Area
Average Home Value in this Area
Purchase History
| Date | Buyer | Sale Price | Title Company |
|---|---|---|---|
| Brand Christopher | $153,000 | Surety Title Services Of Flo | |
| Shilingford Tamica | $149,990 | North American Title Company | |
| Lennar Homes Llc | $510,697 | Attorney |
Source: Public Records
Mortgage History
| Date | Status | Borrower | Loan Amount |
|---|---|---|---|
| Open | Brand Christopher | $145,350 | |
| Previous Owner | Shilingford Tamica | $142,490 | |
| Previous Owner | Lennar Homes Llc | $462,697 |
Source: Public Records
Tax History
| Year | Tax Paid | Tax Assessment Tax Assessment Total Assessment is a certain percentage of the fair market value that is determined by local assessors to be the total taxable value of land and additions on the property. | Land | Improvement |
|---|---|---|---|---|
| 2026 | $2,122 | $160,750 | -- | -- |
| 2025 | $2,122 | $160,750 | -- | -- |
| 2024 | $2,122 | $151,820 | -- | -- |
| 2023 | $2,036 | $147,400 | $20,605 | $126,795 |
| 2022 | $1,823 | $143,110 | $0 | $0 |
| 2021 | $1,780 | $138,950 | $18,480 | $120,470 |
| 2020 | $1,747 | $137,040 | $18,480 | $118,560 |
| 2019 | $1,710 | $133,961 | $18,480 | $115,481 |
| 2018 | $1,686 | $132,302 | $0 | $0 |
| 2017 | $1,674 | $129,581 | $18,480 | $111,101 |
| 2016 | $1,493 | $119,779 | $0 | $0 |
| 2015 | $1,512 | $118,946 | $0 | $0 |
| 2014 | $1,467 | $118,002 | $23,960 | $94,042 |
Source: Public Records
Map
Nearby Homes
- 9736 Trumpet Vine Loop
- 9540 Trumpet Vine Loop
- 9476 Trumpet Vine Loop
- 9871 Trumpet Vine Loop
- 9651 Venturi Dr
- 9704 Milano Dr
- 1449 Kaffir Lily Ct
- 9738 Milano Dr
- 9829 Milano Dr
- 9933 Milano Dr
- 9212 Bonnington Dr
- 9222 Bonnington Dr
- 1623 Crossvine Ct
- 1032 Toski Dr
- 9138 Callaway Dr
- 10435 Pontofino Cir
- 10316 Sorenstam Dr
- 10700 Pontofino Cir
- 1543 Parilla Cir
- 2108 Hammock Park Ct
- 9759 Trumpet Vine Loop
- 9763 Trumpet Vine Loop
- 9757 Trumpet Vine Loop
- 9765 Trumpet Vine Loop
- 9767 Trumpet Vine Loop
- 9755 Trumpet Vine Loop
- 9753 Trumpet Vine Loop
- 9751 Trumpet Vine Loop
- 9773 Trumpet Vine Loop
- 9775 Trumpet Vine Loop
- 9777 Trumpet Vine Loop
- 9743 Trumpet Vine Loop
- 9741 Trumpet Vine Loop
- 9781 Trumpet Vine Loop
- 9783 Trumpet Vine Loop
- 9739 Trumpet Vine Loop
- 9737 Trumpet Vine Loop
- 9764 Trumpet Vine Loop
- 9785 Trumpet Vine Loop
Your Personal Tour Guide
Ask me questions while you tour the home.