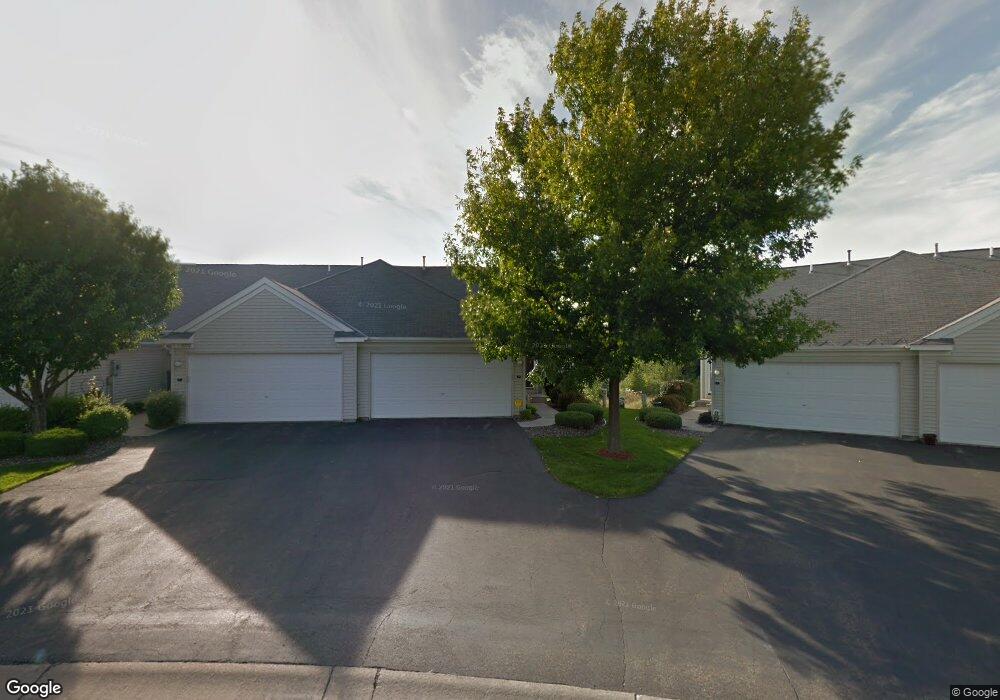
9779 Yucca Ln N Maple Grove, MN 55369
Estimated Value: $279,000 - $298,095
2
Beds
2
Baths
1,760
Sq Ft
$165/Sq Ft
Est. Value
About This Home
This home is located at 9779 Yucca Ln N, Maple Grove, MN 55369 and is currently estimated at $289,524, approximately $164 per square foot. 9779 Yucca Ln N is a home located in Hennepin County with nearby schools including Fernbrook Elementary School, Osseo Middle School, and Maple Grove Senior High School.
Ownership History
Date
Name
Owned For
Owner Type
Purchase Details
Closed on
Nov 13, 2020
Sold by
Ronning Scott H and Ronning Sandy
Bought by
Johnson Elizabeth Marie and Brown Rodney Alan
Current Estimated Value
Home Financials for this Owner
Home Financials are based on the most recent Mortgage that was taken out on this home.
Original Mortgage
$212,000
Outstanding Balance
$188,650
Interest Rate
2.8%
Mortgage Type
New Conventional
Estimated Equity
$100,874
Purchase Details
Closed on
Jul 29, 2005
Sold by
Fournier Donald N and Fournier Rosalie G
Bought by
Ronning Scott and Ronning Sandy
Purchase Details
Closed on
Jan 8, 1999
Sold by
The Rottlund Co
Bought by
Fournier Donald N and Fournier Rosalie
Purchase Details
Closed on
Jul 9, 1998
Sold by
Arcon Development Inc
Bought by
The Rottlund Company Inc
Create a Home Valuation Report for This Property
The Home Valuation Report is an in-depth analysis detailing your home's value as well as a comparison with similar homes in the area
Home Values in the Area
Average Home Value in this Area
Purchase History
| Date | Buyer | Sale Price | Title Company |
|---|---|---|---|
| Johnson Elizabeth Marie | $265,000 | Results Title | |
| Ronning Scott | $222,000 | -- | |
| Fournier Donald N | $151,500 | -- | |
| The Rottlund Company Inc | $98,000 | -- | |
| Johnson Elizabeth Elizabeth | $265,000 | -- |
Source: Public Records
Mortgage History
| Date | Status | Borrower | Loan Amount |
|---|---|---|---|
| Open | Johnson Elizabeth Marie | $212,000 | |
| Closed | Johnson Elizabeth Elizabeth | $212,000 |
Source: Public Records
Tax History Compared to Growth
Tax History
| Year | Tax Paid | Tax Assessment Tax Assessment Total Assessment is a certain percentage of the fair market value that is determined by local assessors to be the total taxable value of land and additions on the property. | Land | Improvement |
|---|---|---|---|---|
| 2024 | $3,310 | $288,700 | $75,700 | $213,000 |
| 2023 | $3,511 | $306,900 | $95,600 | $211,300 |
| 2022 | $2,770 | $283,100 | $56,800 | $226,300 |
| 2021 | $2,835 | $241,000 | $50,000 | $191,000 |
| 2020 | $2,682 | $242,200 | $59,000 | $183,200 |
| 2019 | $2,560 | $220,300 | $46,600 | $173,700 |
| 2018 | $2,481 | $201,200 | $43,000 | $158,200 |
| 2017 | $2,521 | $188,600 | $51,000 | $137,600 |
| 2016 | $2,369 | $176,800 | $50,500 | $126,300 |
| 2015 | $2,353 | $171,700 | $49,000 | $122,700 |
| 2014 | -- | $139,700 | $35,000 | $104,700 |
Source: Public Records
Map
Nearby Homes
- 9828 Zinnia Ln N
- 13655 97th Place N
- 13391 Territorial Cir N
- 13473 Territorial Cir N
- 13744 94th Ave N
- 15181 116th N
- 11629 Minnesota N
- 15177 116th N
- 11621 Minnesota N
- 11617 Minnesota N
- 10955 Glacier Ln N
- 9421 Dallas Ln N
- 9491 Rosewood Ln N
- 13824 102nd Place N
- 9252 Zinnia Ln N
- 9516 Kingsview Ln N
- 14291 92nd Ave N
- 9222 92nd Cir N
- 10385 Glacier Ln N
- 10391 Glacier Ln N
- 9771 Yucca Ln N
- 9783 Yucca Ln N
- 9787 Yucca Ln N
- 9767 Yucca Ln N
- 9791 Yucca Ln N
- 9795 Yucca Ln N
- 9763 Yucca Ln N
- 9759 Yucca Ln N
- 9799 Yucca Ln N
- 9755 Yucca Ln N
- 9803 Yucca Ln N
- 9802 Yucca Ln N
- 9751 Yucca Ln N
- 9832 Zinnia Ln N
- 9798 Yucca Ln N
- 13620 97th Place N
- 9836 Zinnia Ln N
- 13628 97th Place N
- 9824 Zinnia Ln N
- 9840 Zinnia Ln N