Estimated Value: $380,074 - $434,000
4
Beds
3
Baths
2,407
Sq Ft
$168/Sq Ft
Est. Value
About This Home
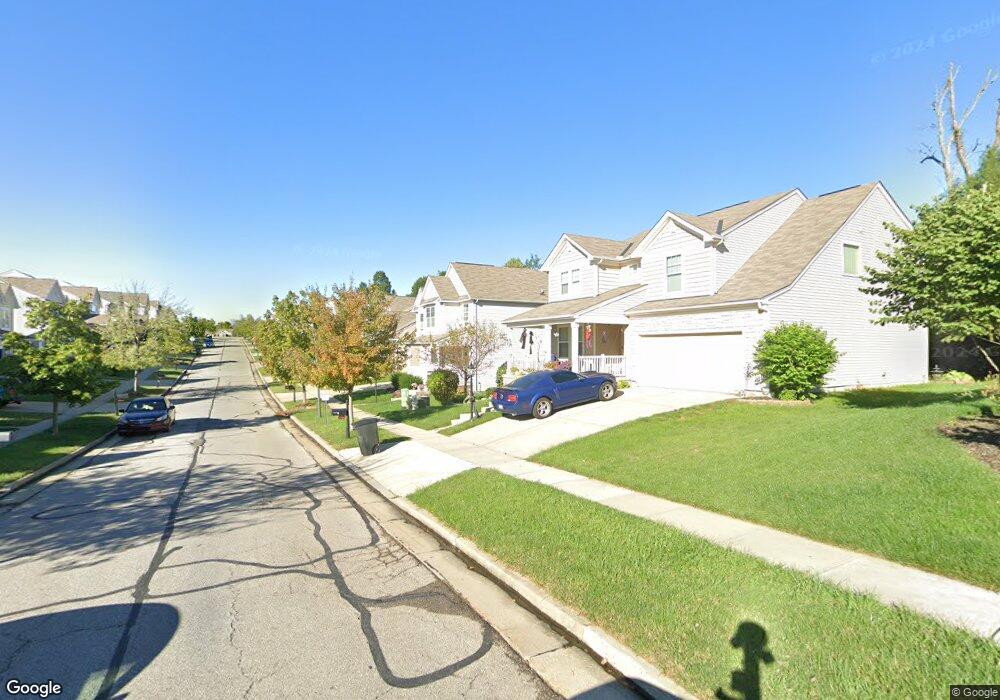
This home is located at 9782 Soaring Breezes, Union, KY 41091 and is currently estimated at $405,519, approximately $168 per square foot. 9782 Soaring Breezes is a home located in Boone County with nearby schools including Erpenbeck Elementary School, Ockerman Middle School, and Larry A. Ryle High School.
Ownership History
Date
Name
Owned For
Owner Type
Purchase Details
Closed on
Jul 25, 2019
Sold by
Mehendale Kiran and Joshi Aishwarya
Bought by
Knopf Scott and Knopf Rebecca
Current Estimated Value
Home Financials for this Owner
Home Financials are based on the most recent Mortgage that was taken out on this home.
Original Mortgage
$211,000
Outstanding Balance
$184,059
Interest Rate
3.82%
Mortgage Type
New Conventional
Estimated Equity
$221,460
Purchase Details
Closed on
May 21, 2012
Sold by
M/I Homes Of Cincinnati Llc
Bought by
Mehendale Kiran and Joshi Aishwarya
Home Financials for this Owner
Home Financials are based on the most recent Mortgage that was taken out on this home.
Original Mortgage
$191,418
Interest Rate
3.3%
Mortgage Type
FHA
Purchase Details
Closed on
Aug 15, 2011
Sold by
The Drees Company
Bought by
M/I Homes Of Cincinnati Llc
Create a Home Valuation Report for This Property
The Home Valuation Report is an in-depth analysis detailing your home's value as well as a comparison with similar homes in the area
Home Values in the Area
Average Home Value in this Area
Purchase History
| Date | Buyer | Sale Price | Title Company |
|---|---|---|---|
| Knopf Scott | $237,000 | Agility Closing & Ttl Svcs I | |
| Mehendale Kiran | $194,950 | First Title Agency | |
| M/I Homes Of Cincinnati Llc | $225,000 | None Available |
Source: Public Records
Mortgage History
| Date | Status | Borrower | Loan Amount |
|---|---|---|---|
| Open | Knopf Scott | $211,000 | |
| Previous Owner | Mehendale Kiran | $191,418 |
Source: Public Records
Tax History
| Year | Tax Paid | Tax Assessment Tax Assessment Total Assessment is a certain percentage of the fair market value that is determined by local assessors to be the total taxable value of land and additions on the property. | Land | Improvement |
|---|---|---|---|---|
| 2025 | $3,204 | $280,000 | $40,000 | $240,000 |
| 2024 | $3,151 | $280,000 | $40,000 | $240,000 |
| 2023 | $3,186 | $280,000 | $40,000 | $240,000 |
| 2022 | $2,661 | $237,000 | $45,000 | $192,000 |
| 2021 | $2,741 | $237,000 | $45,000 | $192,000 |
| 2020 | $2,713 | $237,000 | $45,000 | $192,000 |
| 2019 | $2,258 | $194,950 | $45,000 | $149,950 |
| 2018 | $2,299 | $194,950 | $45,000 | $149,950 |
| 2017 | $2,224 | $194,950 | $45,000 | $149,950 |
| 2015 | $2,197 | $194,950 | $45,000 | $149,950 |
| 2013 | -- | $194,950 | $45,000 | $149,950 |
Source: Public Records
Map
Nearby Homes
- 1525 Sweetsong Dr
- 9651 Soaring Breezes
- 9521 Sapphire Ln
- 9616 Soaring Breezes
- 2016 Dawns Light Rd
- 8554 Concerto Ct
- 8524 Concerto Ct
- 8554 Concerto Ct Unit 251B
- 8566 Concerto Ct
- 8570 Concerto Ct
- 8558 Concerto Ct Unit 251C
- 8558 Concerto Ct
- 1984 Prosperity Ct
- 1970 Prosperity Ct
- 4932 Kerry Crossing Ln
- 4908 Kerry Crossing Ln
- 10077 Russwill Ln
- 9419 Gettysburg Ln
- 2175 Esplanade St
- 2179 Esplanade St
- 9782 Soaring Breezes Unit 89
- 9786 Soaring Breezes
- 9778 Soaring Breezes Unit 90
- 9778 Soaring Breezes
- 9781 Soaring Breezes
- 9777 Soaring Breezes
- 9785 Soaring Breezes
- 9774 Soaring Breezes Unit 91
- 9774 Soaring Breezes
- 9773 Soaring Breezes
- 3676 Evensong Dr
- 3684 Evensong Dr
- 9769 Soaring Breezes
- 9770 Soaring Breezes
- 9770 Soaring Breezes Unit 92
- 9770 Soaring Breezes
- 3672 Evensong Dr
- 3688 Evensong Dr
- 9765 Soaring Breezes
- 9766 Soaring Breezes
Your Personal Tour Guide
Ask me questions while you tour the home.