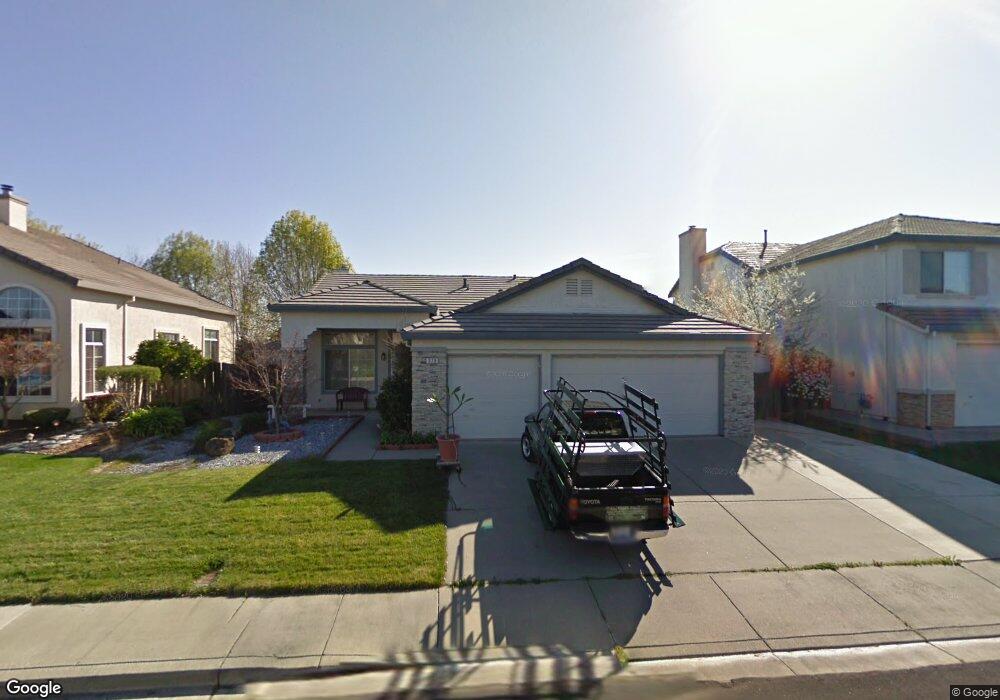
979 Copper Way Vacaville, CA 95687
Estimated Value: $603,473 - $633,000
4
Beds
2
Baths
1,840
Sq Ft
$339/Sq Ft
Est. Value
About This Home
This home is located at 979 Copper Way, Vacaville, CA 95687 and is currently estimated at $623,118, approximately $338 per square foot. 979 Copper Way is a home located in Solano County with nearby schools including Cambridge Elementary School, Golden West Middle School, and Vanden High School.
Ownership History
Date
Name
Owned For
Owner Type
Purchase Details
Closed on
Jul 16, 2021
Sold by
Decker Gina D and Carolyn J Oreta Irrevocable Tr
Bought by
Decker Gina D
Current Estimated Value
Home Financials for this Owner
Home Financials are based on the most recent Mortgage that was taken out on this home.
Original Mortgage
$60,000
Outstanding Balance
$52,664
Interest Rate
2.99%
Mortgage Type
Credit Line Revolving
Estimated Equity
$570,454
Purchase Details
Closed on
Nov 11, 2015
Sold by
Oreta Carolyn
Bought by
Decker Gina D
Purchase Details
Closed on
Oct 18, 2000
Sold by
Oreta Richard
Bought by
Oreta Carolyn
Purchase Details
Closed on
Nov 4, 1999
Sold by
Thagard Jerry L and Thagard Otilia N
Bought by
Oreta Richard and Oreta Carolyn
Purchase Details
Closed on
Apr 17, 1996
Sold by
Lewis Homes Vacaville I
Bought by
Thagard Jerry L and Thagard Otilia N
Create a Home Valuation Report for This Property
The Home Valuation Report is an in-depth analysis detailing your home's value as well as a comparison with similar homes in the area
Purchase History
| Date | Buyer | Sale Price | Title Company |
|---|---|---|---|
| Decker Gina D | -- | Servicelink | |
| Decker Gina D | -- | None Available | |
| Oreta Carolyn | -- | -- | |
| Oreta Richard | -- | -- | |
| Thagard Jerry L | $185,500 | First American Title Guarant |
Source: Public Records
Mortgage History
| Date | Status | Borrower | Loan Amount |
|---|---|---|---|
| Open | Decker Gina D | $60,000 |
Source: Public Records
Tax History
| Year | Tax Paid | Tax Assessment Tax Assessment Total Assessment is a certain percentage of the fair market value that is determined by local assessors to be the total taxable value of land and additions on the property. | Land | Improvement |
|---|---|---|---|---|
| 2025 | $4,028 | $298,167 | $76,843 | $221,324 |
| 2024 | $4,028 | $292,322 | $75,337 | $216,985 |
| 2023 | $3,921 | $286,591 | $73,860 | $212,731 |
| 2022 | $3,830 | $280,972 | $72,413 | $208,559 |
| 2021 | $3,716 | $275,464 | $70,994 | $204,470 |
| 2020 | $3,673 | $272,641 | $70,267 | $202,374 |
| 2019 | $3,612 | $267,296 | $68,890 | $198,406 |
| 2018 | $3,565 | $262,056 | $67,540 | $194,516 |
| 2017 | $3,464 | $256,918 | $66,216 | $190,702 |
| 2016 | $3,418 | $251,881 | $64,918 | $186,963 |
| 2015 | $3,371 | $248,098 | $63,943 | $184,155 |
| 2014 | $3,318 | $243,239 | $62,691 | $180,548 |
Source: Public Records
Map
Nearby Homes
- 967 Copper Way
- 3007 Norwich Ct
- 1007 Canterbury Ct
- 897 Sapphire Cir
- 954 Iron Dr
- 448 Potters Ln
- 196 Somerville Dr
- 531 Colonial Cir
- 805 Broadfork Cir
- 250 Somerville Dr
- 7079 Westminster Ct
- 556 Somerville Cir
- 100 Mechanic Ln
- 116 Heritage Ln
- 2361 Newcastle Dr
- 107 Mechanic Ln
- 4007 Drafter Ct
- 154 Brockton Ct
- 339 Aaron Cir
- 4007 Mansfield St
Your Personal Tour Guide
Ask me questions while you tour the home.