98 10th St Cayucos, CA 93430
Cayucos NeighborhoodEstimated Value: $1,343,880 - $1,881,000
About This Home
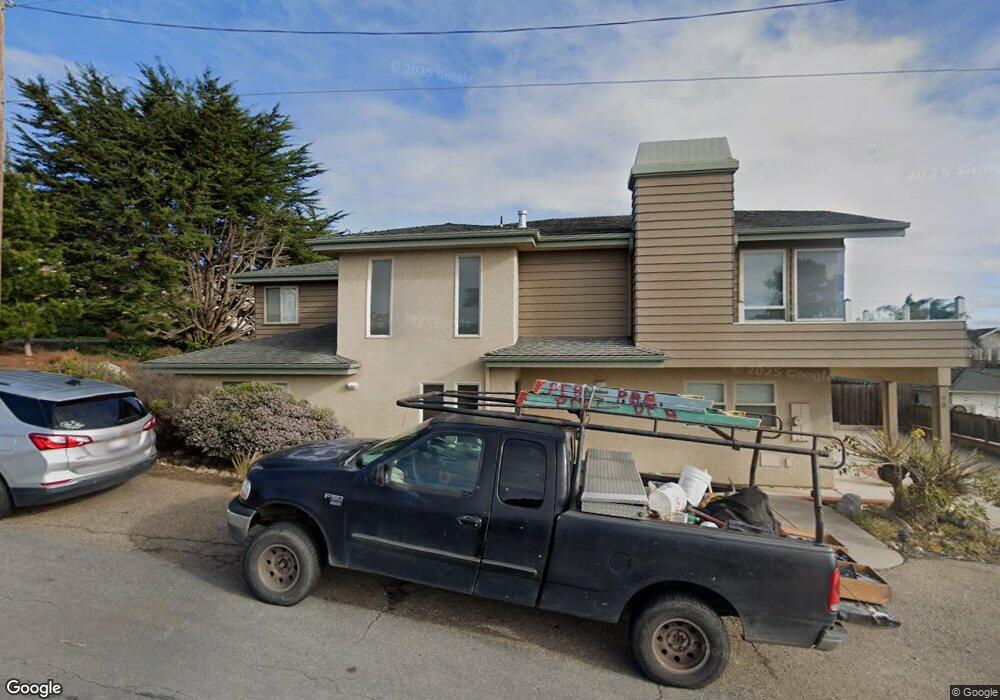
This home is located at 98 10th St, Cayucos, CA 93430 and is currently estimated at $1,578,970, approximately $740 per square foot. 98 10th St is a home located in San Luis Obispo County.
Ownership History
We collect this data history from publicly available records. To have your information removed, we recommend requesting removal directly through your county’s website.
Purchase Details
Purchase Details
Purchase Details
Home Values in the Area
Average Home Value in this Area
Purchase History
We collect this data history from publicly available records. To have your information removed, we recommend requesting removal directly through your county’s website.
| Date | Buyer | Sale Price | Title Company |
|---|---|---|---|
| -- | None Available | ||
| -- | None Available | ||
| -- | None Available | ||
| -- | None Available | ||
| -- | None Available | ||
| -- | None Available | ||
| -- | None Available | ||
| -- | None Available |
Tax History
We collect this data history from publicly available records. To have your information removed, we recommend requesting removal directly through your county’s website.
| Year | Tax Paid | Tax Assessment Tax Assessment Total Assessment is a certain percentage of the fair market value that is determined by local assessors to be the total taxable value of land and additions on the property. | Land | Improvement |
|---|---|---|---|---|
| 2025 | $4,617 | $436,968 | $151,444 | $285,524 |
| 2024 | $4,565 | $428,401 | $148,475 | $279,926 |
| 2023 | $4,565 | $420,002 | $145,564 | $274,438 |
| 2022 | $4,487 | $411,767 | $142,710 | $269,057 |
| 2021 | $4,421 | $403,694 | $139,912 | $263,782 |
| 2020 | $4,374 | $399,556 | $138,478 | $261,078 |
| 2019 | $4,288 | $391,722 | $135,763 | $255,959 |
| 2018 | $4,203 | $384,042 | $133,101 | $250,941 |
| 2017 | $4,119 | $376,513 | $130,492 | $246,021 |
| 2016 | $4,038 | $369,132 | $127,934 | $241,198 |
| 2015 | $4,003 | $363,588 | $126,013 | $237,575 |
| 2014 | $3,863 | $356,467 | $123,545 | $232,922 |
Map
- 1000 Saint Mary Ave
- 31 8th St
- 50 5th St
- 510 Park Ave
- 1234 Pacific Ave
- 1625 Cass Ave Unit 22
- 31 N 3rd St
- 57 17th St
- 191 J St
- 29 20th St
- 2023 Circle Dr
- 180 G St
- 96 24th St
- 0 Ash Ave Unit SC25116716
- 77 N Ocean Ave Unit 12
- 0 Studio Dr
- 159 Ash Ave
- 349 N Ocean Ave Unit A13
- 349 N Ocean Ave Unit A3
- 2712 Studio Dr
Ask me questions while you tour the home.