98 High St Tilton, NH 03276
Tilton NeighborhoodEstimated Value: $369,792 - $444,000
3
Beds
2
Baths
2,068
Sq Ft
$194/Sq Ft
Est. Value
About This Home
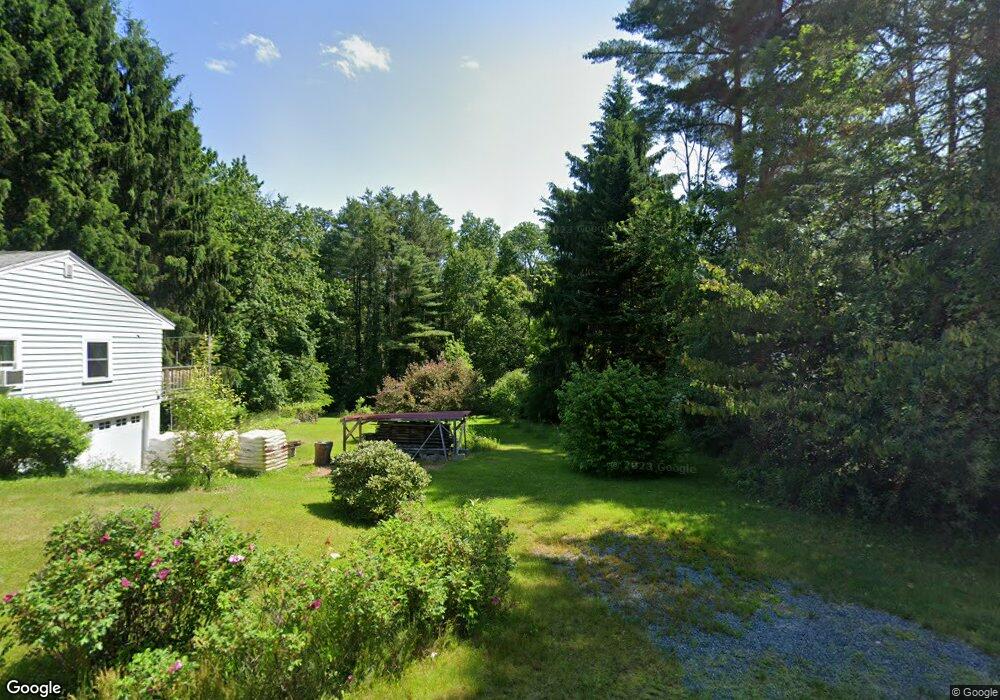
This home is located at 98 High St, Tilton, NH 03276 and is currently estimated at $401,198, approximately $194 per square foot. 98 High St is a home located in Belknap County with nearby schools including Southwick School, Winnisquam Regional Middle School, and Winnisquam Regional High School.
Ownership History
Date
Name
Owned For
Owner Type
Purchase Details
Closed on
May 27, 2005
Sold by
Robert Elizabeth A
Bought by
Fox David G and Fox Lynne A
Current Estimated Value
Home Financials for this Owner
Home Financials are based on the most recent Mortgage that was taken out on this home.
Original Mortgage
$146,750
Outstanding Balance
$28,876
Interest Rate
5.94%
Estimated Equity
$372,322
Create a Home Valuation Report for This Property
The Home Valuation Report is an in-depth analysis detailing your home's value as well as a comparison with similar homes in the area
Home Values in the Area
Average Home Value in this Area
Purchase History
| Date | Buyer | Sale Price | Title Company |
|---|---|---|---|
| Fox David G | $154,500 | -- |
Source: Public Records
Mortgage History
| Date | Status | Borrower | Loan Amount |
|---|---|---|---|
| Open | Fox David G | $146,750 |
Source: Public Records
Tax History Compared to Growth
Tax History
| Year | Tax Paid | Tax Assessment Tax Assessment Total Assessment is a certain percentage of the fair market value that is determined by local assessors to be the total taxable value of land and additions on the property. | Land | Improvement |
|---|---|---|---|---|
| 2024 | $3,200 | $296,300 | $99,400 | $196,900 |
| 2023 | $3,152 | $178,000 | $52,300 | $125,700 |
| 2022 | $2,860 | $178,000 | $52,300 | $125,700 |
| 2021 | $2,912 | $178,000 | $52,300 | $125,700 |
| 2020 | $3,288 | $178,000 | $52,300 | $125,700 |
| 2019 | $3,491 | $178,000 | $52,300 | $125,700 |
| 2018 | $3,621 | $154,500 | $44,300 | $110,200 |
| 2017 | $3,566 | $154,500 | $44,300 | $110,200 |
| 2016 | $3,263 | $157,500 | $44,300 | $113,200 |
| 2015 | $3,618 | $157,500 | $44,300 | $113,200 |
| 2014 | $3,136 | $157,500 | $44,300 | $113,200 |
| 2013 | $2,842 | $155,300 | $42,200 | $113,100 |
| 2012 | $2,878 | $157,700 | $42,200 | $115,500 |
Source: Public Records
Map
Nearby Homes
- 9 High St
- 22 Cedar St
- 4 West St
- 25 Highland Ave
- 94 Winter St
- 100 Colby Rd
- 14 Mountain View Dr
- R02-13 Calef Hill Rd
- 12 Holmes Ave
- 495 W Main St
- 124 E Main St
- 24 Morrison Ave
- 12 Kimball St
- 0 Clark Rd Unit 7-1 5058307
- 97 Calef Hill Rd
- 41 Willow St
- 1 Marsh Hill Cir
- 12 Foothills Way
- 95 Forrest Rd
- 32 Bean Hill Rd