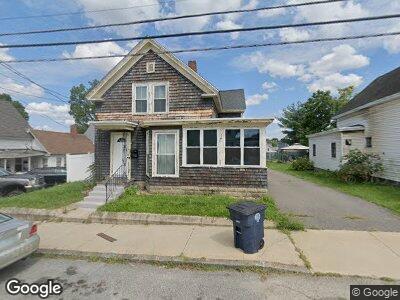
98 Vine St Nashua, NH 03060
South End Nashua NeighborhoodEstimated Value: $449,420 - $480,000
2
Beds
2
Baths
1,486
Sq Ft
$312/Sq Ft
Est. Value
About This Home
This home is located at 98 Vine St, Nashua, NH 03060 and is currently estimated at $463,355, approximately $311 per square foot. 98 Vine St is a home located in Hillsborough County with nearby schools including Fairgrounds Elementary School, Elm Street Middle School, and Nashua High School South.
Ownership History
Date
Name
Owned For
Owner Type
Purchase Details
Closed on
Apr 9, 2015
Sold by
Reed Gregory M and Davis Amanda L
Bought by
Reed Gregory M and Olson Heather
Current Estimated Value
Purchase Details
Closed on
Mar 28, 2006
Sold by
Lemay Lucille A Est
Bought by
Reed Gregory M
Home Financials for this Owner
Home Financials are based on the most recent Mortgage that was taken out on this home.
Original Mortgage
$237,601
Interest Rate
6.28%
Mortgage Type
Purchase Money Mortgage
Create a Home Valuation Report for This Property
The Home Valuation Report is an in-depth analysis detailing your home's value as well as a comparison with similar homes in the area
Home Values in the Area
Average Home Value in this Area
Purchase History
| Date | Buyer | Sale Price | Title Company |
|---|---|---|---|
| Reed Gregory M | -- | -- | |
| Reed Gregory M | $240,000 | -- |
Source: Public Records
Mortgage History
| Date | Status | Borrower | Loan Amount |
|---|---|---|---|
| Open | Gomez Wilson A | $300,000 | |
| Closed | Reed Heather | $205,800 | |
| Closed | Reed Gregory M | $206,870 | |
| Previous Owner | Reed Gregory M | $237,601 |
Source: Public Records
Tax History Compared to Growth
Tax History
| Year | Tax Paid | Tax Assessment Tax Assessment Total Assessment is a certain percentage of the fair market value that is determined by local assessors to be the total taxable value of land and additions on the property. | Land | Improvement |
|---|---|---|---|---|
| 2023 | $7,164 | $393,000 | $103,100 | $289,900 |
| 2022 | $7,102 | $393,000 | $103,100 | $289,900 |
| 2021 | $5,812 | $250,300 | $68,700 | $181,600 |
| 2020 | $5,616 | $248,400 | $68,700 | $179,700 |
| 2019 | $5,405 | $248,400 | $68,700 | $179,700 |
| 2018 | $5,269 | $248,400 | $68,700 | $179,700 |
| 2017 | $4,619 | $179,100 | $63,900 | $115,200 |
| 2016 | $4,490 | $179,100 | $63,900 | $115,200 |
| 2015 | $4,393 | $179,100 | $63,900 | $115,200 |
| 2014 | $4,307 | $179,100 | $63,900 | $115,200 |
Source: Public Records
Map
Nearby Homes