Estimated Value: $592,460 - $705,000
5
Beds
4
Baths
3,120
Sq Ft
$210/Sq Ft
Est. Value
About This Home
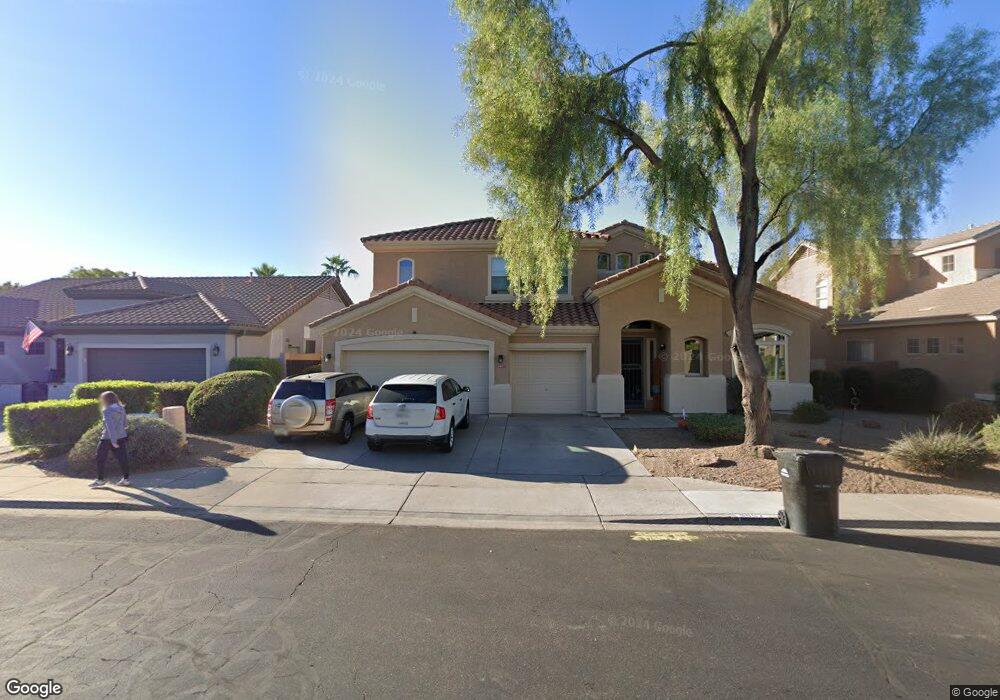
This home is located at 9807 E Monte Ave, Mesa, AZ 85209 and is currently estimated at $655,615, approximately $210 per square foot. 9807 E Monte Ave is a home located in Maricopa County with nearby schools including Augusta Ranch Elementary School, Desert Ridge Jr. High School, and Desert Ridge High School.
Ownership History
Date
Name
Owned For
Owner Type
Purchase Details
Closed on
Nov 8, 2013
Sold by
Jackson Eric H
Bought by
Jackson Eric H and Jackson Velia
Current Estimated Value
Purchase Details
Closed on
Jan 30, 2011
Sold by
Jackson Velia
Bought by
Jackson Eric H
Home Financials for this Owner
Home Financials are based on the most recent Mortgage that was taken out on this home.
Original Mortgage
$260,482
Outstanding Balance
$176,125
Interest Rate
4.84%
Mortgage Type
VA
Estimated Equity
$479,490
Purchase Details
Closed on
Sep 2, 1999
Sold by
Greystone Homes Inc
Bought by
Keating James Robert and Keating Michelle K
Home Financials for this Owner
Home Financials are based on the most recent Mortgage that was taken out on this home.
Original Mortgage
$227,450
Interest Rate
7.77%
Mortgage Type
New Conventional
Create a Home Valuation Report for This Property
The Home Valuation Report is an in-depth analysis detailing your home's value as well as a comparison with similar homes in the area
Purchase History
| Date | Buyer | Sale Price | Title Company |
|---|---|---|---|
| Jackson Eric H | -- | None Available | |
| Jackson Eric H | -- | Magnus Title Agency | |
| Jackson Eric H | $255,000 | Magnus Title Agency | |
| Keating James Robert | $239,461 | North American Title |
Source: Public Records
Mortgage History
| Date | Status | Borrower | Loan Amount |
|---|---|---|---|
| Open | Jackson Eric H | $260,482 | |
| Closed | Jackson Eric H | $260,482 | |
| Previous Owner | Keating James Robert | $227,450 |
Source: Public Records
Tax History
| Year | Tax Paid | Tax Assessment Tax Assessment Total Assessment is a certain percentage of the fair market value that is determined by local assessors to be the total taxable value of land and additions on the property. | Land | Improvement |
|---|---|---|---|---|
| 2025 | $2,309 | $31,175 | -- | -- |
| 2024 | $2,240 | $29,690 | -- | -- |
| 2023 | $2,240 | $44,800 | $8,960 | $35,840 |
| 2022 | $2,186 | $33,700 | $6,740 | $26,960 |
| 2021 | $2,367 | $32,200 | $6,440 | $25,760 |
| 2020 | $2,326 | $29,720 | $5,940 | $23,780 |
| 2019 | $2,156 | $27,680 | $5,530 | $22,150 |
| 2018 | $2,052 | $26,370 | $5,270 | $21,100 |
| 2017 | $1,988 | $25,320 | $5,060 | $20,260 |
| 2016 | $2,061 | $24,860 | $4,970 | $19,890 |
| 2015 | $1,890 | $25,410 | $5,080 | $20,330 |
Source: Public Records
Map
Nearby Homes
- 9812 E Monterey Ave
- 9904 E Monterey Ave
- 9628 E Monte Ave
- 2642 S Joplin
- 9719 E Navarro Ave
- 9831 E Lompoc Ave
- 9637 E Olla Ave
- 9904 E Keats Ave
- 9628 E Lindner Ave
- 9348 E Milagro Ave
- 10205 E Nopal Ave
- 10154 E Nichols Ave
- 9728 E Kiva Ave
- 2415 S Compton
- 9311 E Milagro Ave
- 9534 E Keats Ave
- 2024 S Baldwin Unit 114
- 2024 S Baldwin Unit 54
- 2024 S Baldwin Unit 64
- 10162 E Kilarea Ave Unit 2
- 9815 E Monte Ave
- 9765 E Monte Ave
- 9764 E Monterey Ave
- 9823 E Monte Ave
- 9757 E Monte Ave
- 2452 S Joplin
- 9752 E Monterey Ave
- 9804 E Monterey Ave
- 9766 E Monte Ave
- 9831 E Monte Ave
- 9749 E Monte Ave
- 2444 S Joplin
- 9746 E Monterey Ave
- 9758 E Monte Ave
- 2465 S Joplin
- 9762 E Natal Ave
- 9750 E Monte Ave
- 9741 E Monte Ave
- 2457 S Joplin
- 2436 S Joplin
Your Personal Tour Guide
Ask me questions while you tour the home.