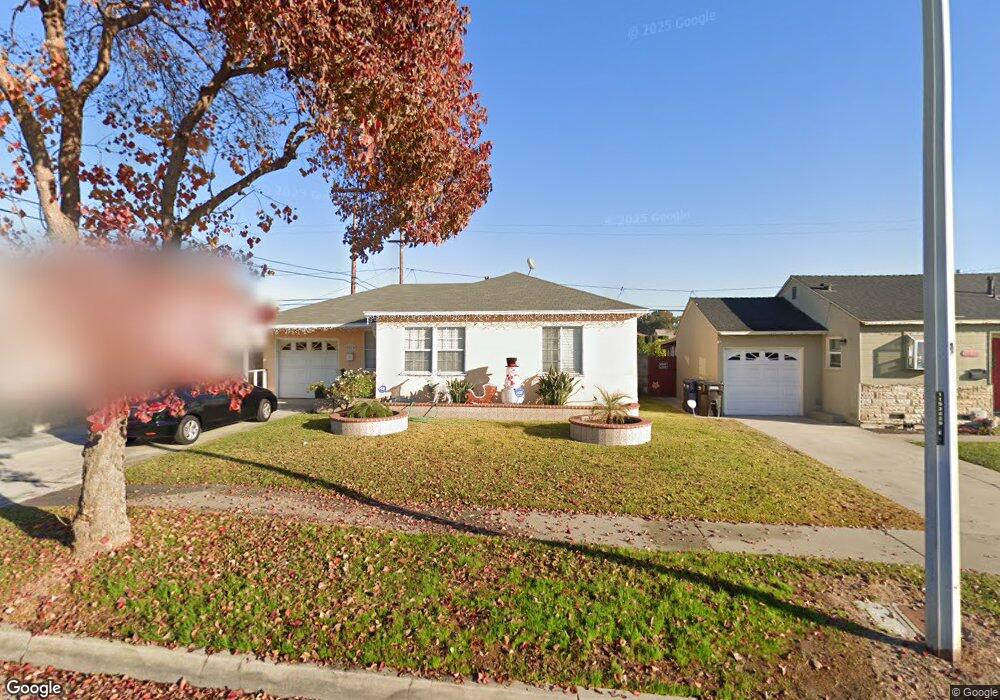
9813 Whiteland St Pico Rivera, CA 90660
Estimated Value: $749,000 - $781,000
3
Beds
2
Baths
1,334
Sq Ft
$575/Sq Ft
Est. Value
About This Home
This home is located at 9813 Whiteland St, Pico Rivera, CA 90660 and is currently estimated at $767,291, approximately $575 per square foot. 9813 Whiteland St is a home located in Los Angeles County with nearby schools including Birney Tech Academy, The STEAM Academy @ Burke, and El Rancho High School.
Ownership History
Date
Name
Owned For
Owner Type
Purchase Details
Closed on
Nov 17, 2005
Sold by
Hong Eric C
Bought by
Hong Anna S
Current Estimated Value
Purchase Details
Closed on
Jul 22, 2002
Sold by
Valenzuela Alejandro
Bought by
Hong Eric C and Hong Anna S
Home Financials for this Owner
Home Financials are based on the most recent Mortgage that was taken out on this home.
Original Mortgage
$209,000
Interest Rate
6.51%
Purchase Details
Closed on
Jan 27, 1998
Sold by
Gallina Mario
Bought by
Valenzuela Alejandro
Home Financials for this Owner
Home Financials are based on the most recent Mortgage that was taken out on this home.
Original Mortgage
$130,200
Interest Rate
7.11%
Mortgage Type
FHA
Create a Home Valuation Report for This Property
The Home Valuation Report is an in-depth analysis detailing your home's value as well as a comparison with similar homes in the area
Home Values in the Area
Average Home Value in this Area
Purchase History
| Date | Buyer | Sale Price | Title Company |
|---|---|---|---|
| Hong Anna S | -- | -- | |
| Hong Eric C | $220,000 | United Title Company | |
| Valenzuela Alejandro | $131,500 | First American |
Source: Public Records
Mortgage History
| Date | Status | Borrower | Loan Amount |
|---|---|---|---|
| Previous Owner | Hong Eric C | $209,000 | |
| Previous Owner | Valenzuela Alejandro | $130,200 |
Source: Public Records
Tax History Compared to Growth
Tax History
| Year | Tax Paid | Tax Assessment Tax Assessment Total Assessment is a certain percentage of the fair market value that is determined by local assessors to be the total taxable value of land and additions on the property. | Land | Improvement |
|---|---|---|---|---|
| 2025 | $5,361 | $378,140 | $221,006 | $157,134 |
| 2024 | $5,361 | $370,726 | $216,673 | $154,053 |
| 2023 | $5,212 | $363,458 | $212,425 | $151,033 |
| 2022 | $4,977 | $356,332 | $208,260 | $148,072 |
| 2021 | $4,854 | $349,346 | $204,177 | $145,169 |
| 2019 | $4,823 | $338,986 | $198,122 | $140,864 |
| 2018 | $4,597 | $332,340 | $194,238 | $138,102 |
| 2017 | $4,550 | $325,825 | $190,430 | $135,395 |
| 2016 | $4,148 | $319,438 | $186,697 | $132,741 |
| 2015 | $4,085 | $314,641 | $183,893 | $130,748 |
| 2014 | $4,033 | $308,478 | $180,291 | $128,187 |
Source: Public Records
Map
Nearby Homes
- 8736 Klinedale Ave
- 8849 Pico Vista Rd
- 9602 Florpark St
- 9950 La Docena Ln
- 9636 Cedartree Rd
- 9822 Bartley Ave
- 11418 Flossmoor Rd
- 9813 Houghton Ave
- 9910 Aspen Cir
- 11523 Willins St
- 8328 Buhman Ave
- 9430 True Ave
- 9311 Claymore St
- 11526 Promenade Dr
- 9438 Houghton Ave
- 11544 Promenade Dr
- 9760 Jersey Ave Unit 173
- 11571 Telegraph Rd
- 9700 Jersey Ave Unit 194
- 11032 Davenrich St
- 9809 Whiteland St
- 9819 Whiteland St
- 9823 Whiteland St
- 9803 Whiteland St
- 9818 Roma St
- 9812 Roma St
- 9822 Roma St
- 9806 Roma St
- 9829 Whiteland St
- 9741 Whiteland St
- 9828 Roma St
- 9812 Whiteland St
- 9802 Roma St
- 9806 Whiteland St
- 9818 Whiteland St
- 9824 Whiteland St
- 8704 True Ave
- 9834 Roma St
- 9833 Whiteland St
- 9735 Whiteland St