
Seller's Agent in 2012
Jeff Speer
RE/MAX
(217) 347-0404
171 Total Sales
Estimated Value: $211,131 - $527,000
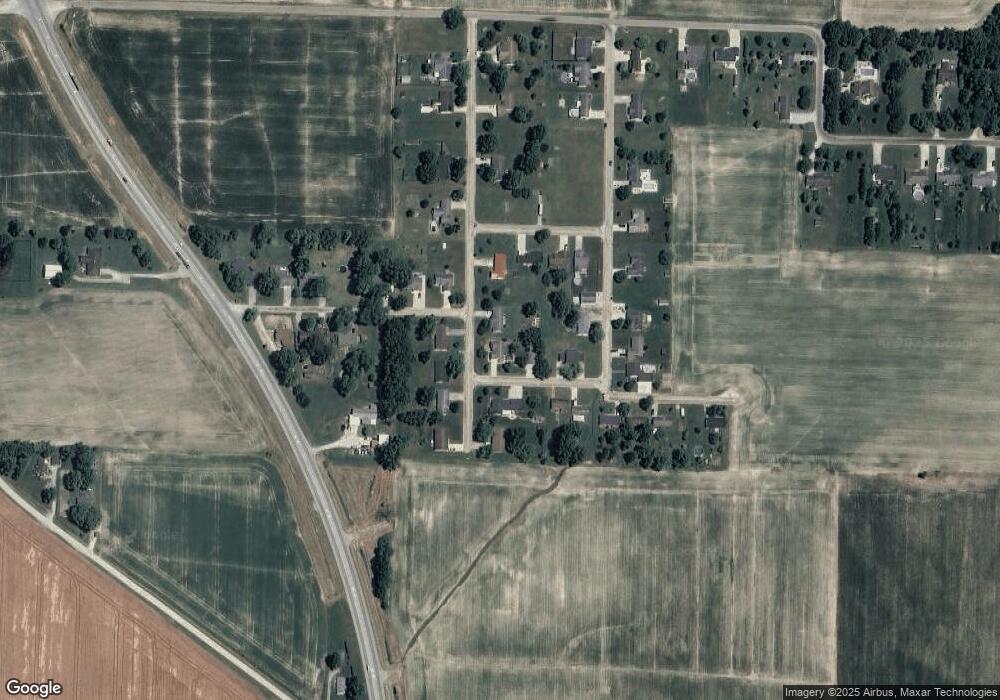
Come take a look at this perfect 1400 sq. ft. 4BR, 3 bath Ranch with a mostly finished basement; large 100 x 200 lot with a 12 x 10 shed for storage; privacy fence; stamped concrete deck & sidewalk 2010
Last Agent to Sell the Property
RE/MAX Key Advantage License #471000363 Listed on: 01/06/2012
| Date | Buyer | Sale Price | Title Company |
|---|---|---|---|
| Crackel Anthony D | $212,000 | None Available | |
| Mcgee Jeffrey L | $142,500 | None Available |
| Date | Status | Borrower | Loan Amount |
|---|---|---|---|
| Open | Crackel Anthony D | $169,600 | |
| Previous Owner | Mcgee Jeffrey L | $95,000 |
| Date | Event | Price | List to Sale | Price per Sq Ft |
|---|---|---|---|---|
| 02/03/2012 02/03/12 | Sold | $142,500 | 0.0% | $102 / Sq Ft |
| 01/06/2012 01/06/12 | Pending | -- | -- | -- |
| 01/06/2012 01/06/12 | For Sale | $142,500 | -- | $102 / Sq Ft |
| Year | Tax Paid | Tax Assessment Tax Assessment Total Assessment is a certain percentage of the fair market value that is determined by local assessors to be the total taxable value of land and additions on the property. | Land | Improvement |
|---|---|---|---|---|
| 2024 | $3,018 | $61,700 | $6,570 | $55,130 |
| 2023 | $2,725 | $55,840 | $5,950 | $49,890 |
| 2022 | $2,517 | $50,760 | $5,410 | $45,350 |
| 2021 | $2,554 | $51,270 | $5,460 | $45,810 |
| 2020 | $2,477 | $49,580 | $5,280 | $44,300 |
| 2019 | $2,397 | $48,140 | $5,130 | $43,010 |
| 2018 | $2,317 | $46,290 | $4,930 | $41,360 |
| 2017 | $2,276 | $44,950 | $4,790 | $40,160 |
| 2016 | $2,005 | $43,230 | $4,610 | $38,620 |
| 2015 | -- | $47,500 | $4,520 | $42,980 |
| 2014 | -- | $46,120 | $4,390 | $41,730 |
| 2013 | -- | $46,120 | $4,390 | $41,730 |
| 2012 | -- | $42,420 | $4,350 | $38,070 |
Seller's Agent in 2012
Jeff Speer
RE/MAX
(217) 347-0404
171 Total Sales
Buyer's Agent in 2012
Marilyn Purcell
RE/MAX
63 Total Sales
Source: Central Illinois Board of REALTORS®
MLS Number: 4214633
APN: 1410162022