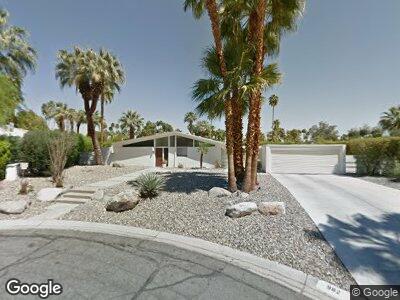
982 N Tuxedo Cir Palm Springs, CA 92262
Vista Las Palmas NeighborhoodEstimated Value: $781,000 - $1,953,000
3
Beds
2
Baths
1,600
Sq Ft
$973/Sq Ft
Est. Value
About This Home
This home is located at 982 N Tuxedo Cir, Palm Springs, CA 92262 and is currently estimated at $1,557,510, approximately $973 per square foot. 982 N Tuxedo Cir is a home located in Riverside County with nearby schools including Katherine Finchy Elementary School, Raymond Cree Middle School, and Palm Springs High School.
Ownership History
Date
Name
Owned For
Owner Type
Purchase Details
Closed on
Jul 21, 2005
Sold by
Budovitch Alan J and Missner Susan L
Bought by
Missner Susan Lee and Susan Lee Missner Declaration Of Trust
Current Estimated Value
Purchase Details
Closed on
May 30, 2001
Sold by
Alexander Blair
Bought by
Budovitch Alan J and Missner Susan L
Purchase Details
Closed on
May 9, 2001
Sold by
Moke Lynn Ryder and Moke Richard F
Bought by
Moke Richard F
Purchase Details
Closed on
May 7, 2001
Sold by
Moke Richard F
Bought by
Alexander Blair and The William Blair Alexander Revocable Li
Purchase Details
Closed on
Oct 26, 1994
Sold by
Waugaman John R
Bought by
Moke Richard F and Moke Lynne Ryder
Home Financials for this Owner
Home Financials are based on the most recent Mortgage that was taken out on this home.
Original Mortgage
$137,000
Interest Rate
8.91%
Create a Home Valuation Report for This Property
The Home Valuation Report is an in-depth analysis detailing your home's value as well as a comparison with similar homes in the area
Home Values in the Area
Average Home Value in this Area
Purchase History
| Date | Buyer | Sale Price | Title Company |
|---|---|---|---|
| Missner Susan Lee | -- | -- | |
| Budovitch Alan J | $390,000 | Chicago Title Co | |
| Alexander Blair | $354,000 | Chicago Title Co | |
| Moke Richard F | $195,000 | Stewart Title Co |
Source: Public Records
Mortgage History
| Date | Status | Borrower | Loan Amount |
|---|---|---|---|
| Previous Owner | Moke Richard F | $137,000 |
Source: Public Records
Tax History Compared to Growth
Tax History
| Year | Tax Paid | Tax Assessment Tax Assessment Total Assessment is a certain percentage of the fair market value that is determined by local assessors to be the total taxable value of land and additions on the property. | Land | Improvement |
|---|---|---|---|---|
| 2023 | $8,968 | $701,478 | $169,441 | $532,037 |
| 2022 | $9,149 | $687,724 | $166,119 | $521,605 |
| 2021 | $8,964 | $674,240 | $162,862 | $511,378 |
| 2020 | $8,561 | $667,328 | $161,193 | $506,135 |
| 2019 | $6,826 | $526,793 | $158,033 | $368,760 |
| 2018 | $6,700 | $516,465 | $154,935 | $361,530 |
| 2017 | $6,601 | $506,340 | $151,898 | $354,442 |
| 2016 | $6,410 | $496,413 | $148,920 | $347,493 |
| 2015 | $6,155 | $488,958 | $146,684 | $342,274 |
| 2014 | $6,083 | $479,381 | $143,811 | $335,570 |
Source: Public Records
Map
Nearby Homes
- 985 N Tuxedo Cir
- 968 N Fairview Cir
- 968 N Rose Ave
- 1148 N Rose Ave
- 1101 N Via Monte Vista
- 823 N Topaz Cir
- 823 N Fair Cir
- 1350 Ladera Cir
- 611 W Leisure Way
- 467 W Via Lola
- 722 N High Rd
- 475 S Via Las Palmas
- 429 Camino Sur
- 670 N Rose Ave
- 425 S Via Las Palmas
- 911 Juarez Ave
- 500 W Crescent Dr
- 555 W Stevens Rd
- 365 Camino Norte
- 718 Las Palmas Estates Dr
- 982 N Tuxedo Cir
- 983 N Coronet Cir
- 996 N Tuxedo Cir
- 978 N Tuxedo Cir
- 979 N Coronet Cir
- 995 N Coronet Cir
- 997 N Tuxedo Cir
- 797 Camino Sur
- 970 N Tuxedo Cir
- 977 N Tuxedo Cir
- 755 Camino Sur
- 967 N Coronet Cir
- 815 Camino Sur
- 733 Camino Sur
- 969 N Tuxedo Cir
- 994 N Coronet Cir
- 984 N Fairview Cir
- 986 N Coronet Cir
- 972 N Coronet Cir
- 845 Camino Del Sur