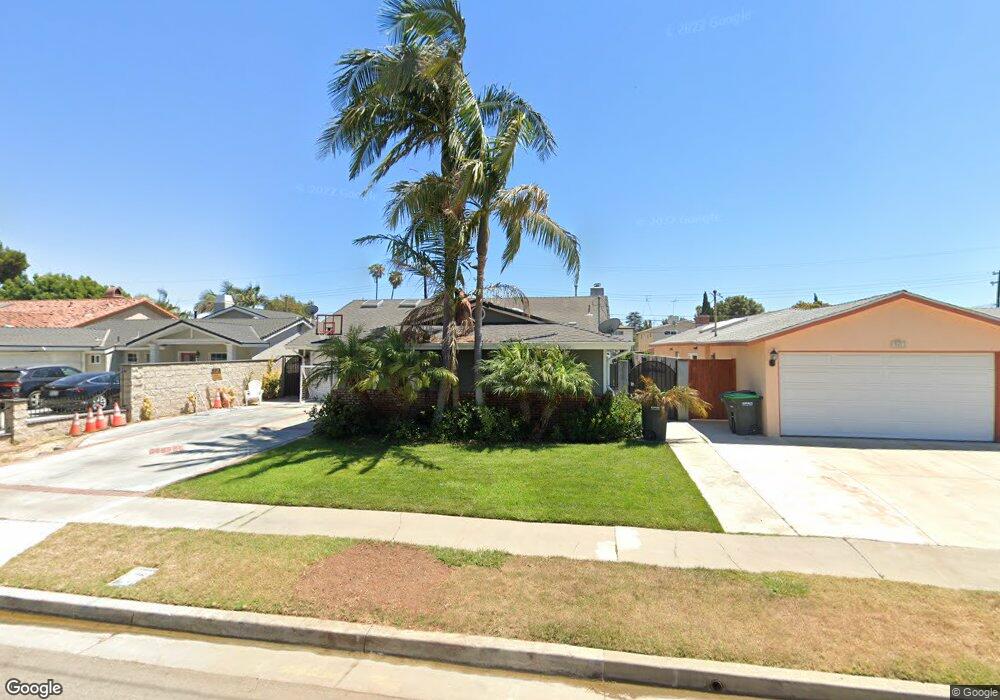
983 Post Rd Costa Mesa, CA 92626
Estimated Value: $842,000 - $1,512,042
4
Beds
4
Baths
1,836
Sq Ft
$682/Sq Ft
Est. Value
About This Home
This home is located at 983 Post Rd, Costa Mesa, CA 92626 and is currently estimated at $1,253,011, approximately $682 per square foot. 983 Post Rd is a home located in Orange County with nearby schools including Sonora Elementary School, Costa Mesa High School, and California Pacific Charter - San Diego.
Ownership History
Date
Name
Owned For
Owner Type
Purchase Details
Closed on
Oct 19, 2024
Sold by
Huerta Jose
Bought by
Huerta Family Trust and Huerta
Current Estimated Value
Purchase Details
Closed on
Oct 20, 2016
Sold by
Huerta Jose
Bought by
Huerta Jose and Huerta Eric
Home Financials for this Owner
Home Financials are based on the most recent Mortgage that was taken out on this home.
Original Mortgage
$402,000
Interest Rate
3.5%
Mortgage Type
New Conventional
Purchase Details
Closed on
Jan 4, 2002
Sold by
Huerta Margarita
Bought by
Huerta Jose
Home Financials for this Owner
Home Financials are based on the most recent Mortgage that was taken out on this home.
Original Mortgage
$150,000
Interest Rate
6.84%
Purchase Details
Closed on
Nov 27, 2001
Sold by
Fryer Roger M and Fryer Mary O
Bought by
Huerta Jose
Home Financials for this Owner
Home Financials are based on the most recent Mortgage that was taken out on this home.
Original Mortgage
$150,000
Interest Rate
6.84%
Create a Home Valuation Report for This Property
The Home Valuation Report is an in-depth analysis detailing your home's value as well as a comparison with similar homes in the area
Purchase History
| Date | Buyer | Sale Price | Title Company |
|---|---|---|---|
| Huerta Family Trust | -- | None Listed On Document | |
| Huerta Jose | -- | Lawyers Title | |
| Huerta Eric | -- | Lawyers Title | |
| Huerta Jose | -- | Lawyers Title | |
| Huerta Jose | -- | Commonwealth Land Title | |
| Huerta Jose | $300,000 | Commonwealth Land Title |
Source: Public Records
Mortgage History
| Date | Status | Borrower | Loan Amount |
|---|---|---|---|
| Previous Owner | Huerta Jose | $402,000 | |
| Previous Owner | Huerta Jose | $150,000 |
Source: Public Records
Tax History
| Year | Tax Paid | Tax Assessment Tax Assessment Total Assessment is a certain percentage of the fair market value that is determined by local assessors to be the total taxable value of land and additions on the property. | Land | Improvement |
|---|---|---|---|---|
| 2025 | $5,583 | $946,592 | $823,515 | $123,077 |
| 2024 | $5,583 | $434,490 | $317,292 | $117,198 |
| 2023 | $5,383 | $425,971 | $311,071 | $114,900 |
| 2022 | $5,184 | $417,619 | $304,971 | $112,648 |
| 2021 | $5,020 | $409,431 | $298,991 | $110,440 |
| 2020 | $4,958 | $405,233 | $295,925 | $109,308 |
| 2019 | $4,853 | $397,288 | $290,123 | $107,165 |
| 2018 | $4,756 | $389,499 | $284,435 | $105,064 |
| 2017 | $4,678 | $381,862 | $278,858 | $103,004 |
| 2016 | $4,582 | $374,375 | $273,390 | $100,985 |
| 2015 | $4,538 | $368,752 | $269,283 | $99,469 |
| 2014 | $4,437 | $361,529 | $264,008 | $97,521 |
Source: Public Records
Map
Nearby Homes
- 1034 El Camino Dr
- 945 Lansing Ln
- 938 Cheyenne St
- 825 Sonora Rd
- 872 Magellan St
- 2723 Cibola Ave
- 913 Junipero Dr
- 810 Baker St Unit 210
- 781 Grayling Bay
- 3072 Tyler Way
- 1068 Concord St
- 1147 Charleston St
- 13651 Olympic Ave
- 3023 Murray Ln
- 1070 Visalia Dr
- 3375 Fuchsia St
- 937 Carnation Ave
- 2682 Pala Mesa Ct
- 2563 Columbia Dr
- 135 Del Mar Ave
Your Personal Tour Guide
Ask me questions while you tour the home.