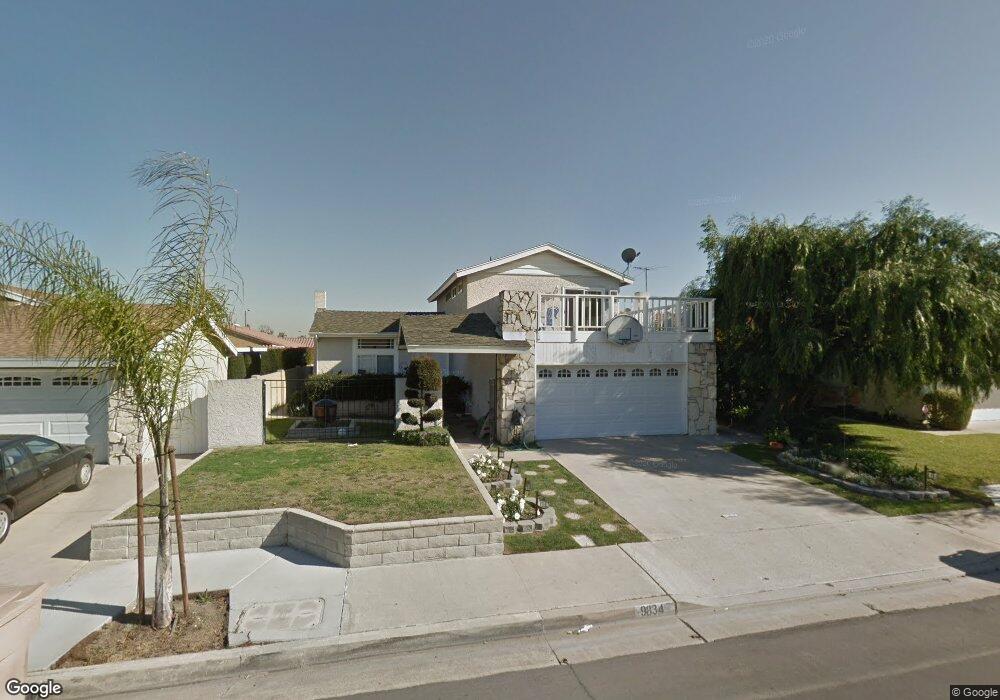
9834 Spruce Ct Cypress, CA 90630
Estimated Value: $1,090,906 - $1,198,000
3
Beds
3
Baths
1,876
Sq Ft
$612/Sq Ft
Est. Value
About This Home
This home is located at 9834 Spruce Ct, Cypress, CA 90630 and is currently estimated at $1,148,727, approximately $612 per square foot. 9834 Spruce Ct is a home located in Orange County with nearby schools including Juliet Morris Elementary School, Lexington Junior High School, and Cypress High School.
Ownership History
Date
Name
Owned For
Owner Type
Purchase Details
Closed on
Feb 11, 2021
Sold by
Carlo Joanne D Di
Bought by
Carlo Joanne D Di and Joanne D Di Carlo Revocable Tr
Current Estimated Value
Purchase Details
Closed on
Feb 11, 1993
Sold by
Cooke Robert K and Cooke Kae Ann
Bought by
Dicarlo Americo A and Dicarlo Joanne D
Home Financials for this Owner
Home Financials are based on the most recent Mortgage that was taken out on this home.
Original Mortgage
$102,000
Interest Rate
7.74%
Create a Home Valuation Report for This Property
The Home Valuation Report is an in-depth analysis detailing your home's value as well as a comparison with similar homes in the area
Home Values in the Area
Average Home Value in this Area
Purchase History
| Date | Buyer | Sale Price | Title Company |
|---|---|---|---|
| Carlo Joanne D Di | -- | None Available | |
| Dicarlo Americo A | $247,000 | -- |
Source: Public Records
Mortgage History
| Date | Status | Borrower | Loan Amount |
|---|---|---|---|
| Closed | Dicarlo Americo A | $102,000 |
Source: Public Records
Tax History
| Year | Tax Paid | Tax Assessment Tax Assessment Total Assessment is a certain percentage of the fair market value that is determined by local assessors to be the total taxable value of land and additions on the property. | Land | Improvement |
|---|---|---|---|---|
| 2025 | $4,874 | $428,211 | $285,952 | $142,259 |
| 2024 | $4,874 | $419,815 | $280,345 | $139,470 |
| 2023 | $4,761 | $411,584 | $274,848 | $136,736 |
| 2022 | $4,703 | $403,514 | $269,459 | $134,055 |
| 2021 | $4,640 | $395,602 | $264,175 | $131,427 |
| 2020 | $4,621 | $391,546 | $261,466 | $130,080 |
| 2019 | $4,492 | $383,869 | $256,339 | $127,530 |
| 2018 | $4,431 | $376,343 | $251,313 | $125,030 |
| 2017 | $4,280 | $368,964 | $246,385 | $122,579 |
| 2016 | $4,243 | $361,730 | $241,554 | $120,176 |
| 2015 | $4,210 | $356,297 | $237,926 | $118,371 |
| 2014 | $3,988 | $349,318 | $233,265 | $116,053 |
Source: Public Records
Map
Nearby Homes
- 5353 Cumberland Dr
- 5843 La Jolla Way Unit 28
- 5482 Myra Ave
- 9948 Del Rio Way Unit 98
- 5372 Harvard Way
- 5068 Cumberland Dr
- 10411 Saint Alban St
- 10441 Rexford Dr
- 9011 Cerise Ln Unit 129
- 9001 Cerise Ln Unit 109
- 9001 Cerise Ln Unit 113
- 9598 Naples Dr
- 6007 Clementine Ln Unit 21
- 9332 Nancy St
- 5000 Clementine Ln
- 9702 Juanita St
- 4790 Montefino Dr
- 10305 Eudora Ave
- 5342 Bishop St
- 10292 Ethel St
Your Personal Tour Guide
Ask me questions while you tour the home.