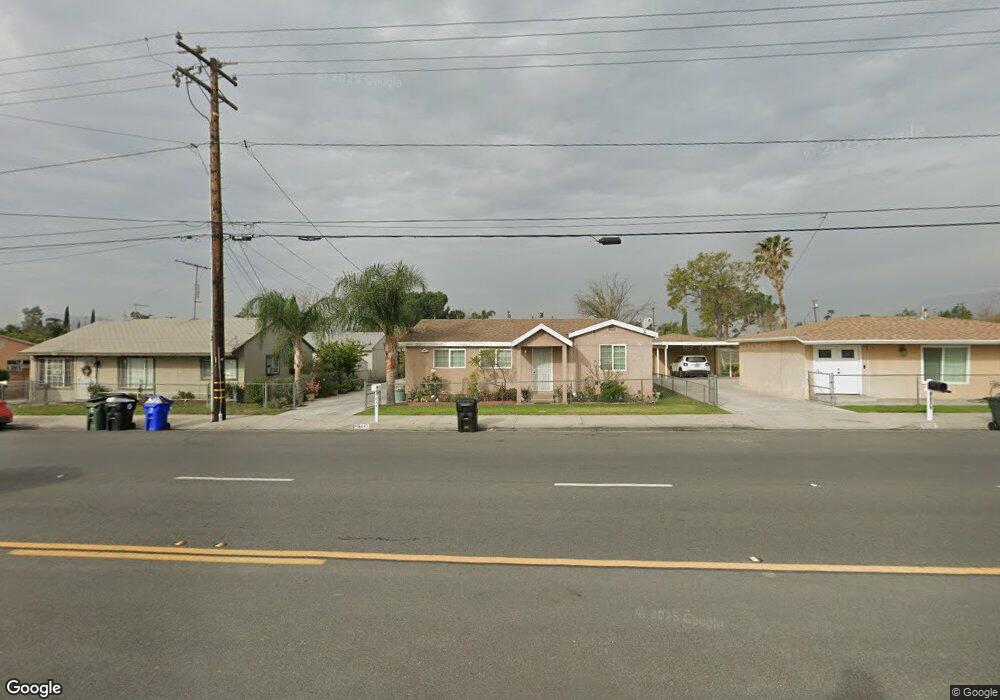
9844 Cedar Ave Bloomington, CA 92316
Estimated Value: $430,311 - $494,000
2
Beds
1
Bath
892
Sq Ft
$510/Sq Ft
Est. Value
About This Home
This home is located at 9844 Cedar Ave, Bloomington, CA 92316 and is currently estimated at $454,578, approximately $509 per square foot. 9844 Cedar Ave is a home located in San Bernardino County with nearby schools including Gerald A. Smith Elementary School, Joe Baca, and Bloomington High School.
Ownership History
Date
Name
Owned For
Owner Type
Purchase Details
Closed on
Aug 5, 2019
Sold by
Gonzalez Francisco J and Gonzalez Silvia M
Bought by
Gonzalez Francisco J and Gonzalez Silvia M
Current Estimated Value
Home Financials for this Owner
Home Financials are based on the most recent Mortgage that was taken out on this home.
Original Mortgage
$179,523
Outstanding Balance
$156,244
Interest Rate
3.4%
Mortgage Type
New Conventional
Estimated Equity
$298,334
Purchase Details
Closed on
Jul 9, 2018
Sold by
Gonzalez Franciso Javier and Gonzalez Silvia M
Bought by
Gonzalez Francisco Javier and Gonzalez Silvia M
Home Financials for this Owner
Home Financials are based on the most recent Mortgage that was taken out on this home.
Original Mortgage
$178,000
Interest Rate
4.5%
Mortgage Type
New Conventional
Purchase Details
Closed on
Feb 2, 1993
Sold by
Gonzalez Francisco Javier and Gonzalez Silvia M
Bought by
County Of San Bernardino
Create a Home Valuation Report for This Property
The Home Valuation Report is an in-depth analysis detailing your home's value as well as a comparison with similar homes in the area
Home Values in the Area
Average Home Value in this Area
Purchase History
| Date | Buyer | Sale Price | Title Company |
|---|---|---|---|
| Gonzalez Francisco J | -- | First American Title | |
| Gonzalez Francisco J | -- | None Available | |
| Gonzalez Francisco Javier | -- | Chicago Title Company | |
| County Of San Bernardino | -- | Union Land Title Company |
Source: Public Records
Mortgage History
| Date | Status | Borrower | Loan Amount |
|---|---|---|---|
| Open | Gonzalez Francisco J | $179,523 | |
| Closed | Gonzalez Francisco Javier | $178,000 |
Source: Public Records
Tax History
| Year | Tax Paid | Tax Assessment Tax Assessment Total Assessment is a certain percentage of the fair market value that is determined by local assessors to be the total taxable value of land and additions on the property. | Land | Improvement |
|---|---|---|---|---|
| 2025 | $1,793 | $136,022 | $64,396 | $71,626 |
| 2024 | $1,712 | $133,355 | $63,133 | $70,222 |
| 2023 | $1,710 | $130,740 | $61,895 | $68,845 |
| 2022 | $1,681 | $128,176 | $60,681 | $67,495 |
| 2021 | $1,705 | $125,663 | $59,491 | $66,172 |
| 2020 | $2,299 | $169,582 | $67,587 | $101,995 |
| 2019 | $1,663 | $121,930 | $57,725 | $64,205 |
| 2018 | $1,479 | $119,539 | $56,593 | $62,946 |
| 2017 | $1,426 | $117,195 | $55,483 | $61,712 |
| 2016 | $1,460 | $114,897 | $54,395 | $60,502 |
| 2015 | $1,412 | $113,171 | $53,578 | $59,593 |
| 2014 | $1,356 | $110,954 | $52,528 | $58,426 |
Source: Public Records
Map
Nearby Homes
- 9824 Linden Ave
- 18793 San Bernardino Ave
- 18325 El Molino St
- 18411 Valley Blvd
- 18411 Valley Blvd Unit 64
- 18411 Valley Blvd Unit 39
- 18411 Valley Blvd Unit 56
- 18251 Marygold Ave
- 18605 Sequoia Ave
- 9416 Cedar Ave
- 18316 W Hawthorne St
- 778 Bloomington Ave
- 839 S Aspen Ave
- 1208 S Fillmore Ave
- 18490 Santa Ana
- 669 W Grovewood Ave
- 10555 Elm Ave
- 9454 Frankfort Ave
- 10573 Larch Ave
- 1459 W James St
- 9836 Cedar Ave
- 9854 Cedar Ave
- 9826 Cedar Ave
- 9864 Cedar Ave
- 9841 Magnolia St
- 9816 Cedar Ave
- 9851 Magnolia St
- 9831 Magnolia St
- 9861 Magnolia St
- 9823 Magnolia St
- 9804 Cedar Ave
- 9880 Cedar Ave
- 9813 Magnolia St
- 9805 Magnolia St
- 9881 Magnolia St
- 9798 Cedar Ave
- 9890 Cedar Ave
- 18658 Marygold Ave
- 9797 Magnolia St
- 9790 Cedar Ave
Your Personal Tour Guide
Ask me questions while you tour the home.