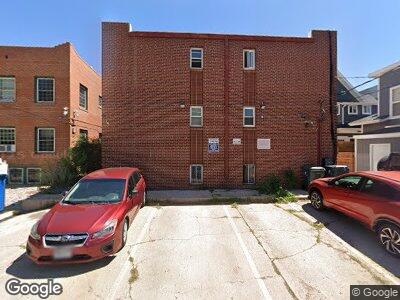
985 N Corona St Unit 204 Denver, CO 80218
Capitol Hill NeighborhoodEstimated Value: $250,000 - $262,000
1
Bed
1
Bath
567
Sq Ft
$455/Sq Ft
Est. Value
About This Home
This home is located at 985 N Corona St Unit 204, Denver, CO 80218 and is currently estimated at $258,254, approximately $455 per square foot. 985 N Corona St Unit 204 is a home located in Denver County with nearby schools including Dora Moore ECE-8 School, Morey Middle School, and East High School.
Ownership History
Date
Name
Owned For
Owner Type
Purchase Details
Closed on
Jul 20, 2018
Sold by
Lenz Mason
Bought by
Jungers Joel W and Giarrusso Lea
Current Estimated Value
Purchase Details
Closed on
Dec 28, 2012
Sold by
Loucks Stacie D
Bought by
Lenz Mason
Home Financials for this Owner
Home Financials are based on the most recent Mortgage that was taken out on this home.
Original Mortgage
$103,098
Interest Rate
3.75%
Mortgage Type
FHA
Purchase Details
Closed on
Nov 30, 2000
Sold by
985 Corona Llc
Bought by
Loucks Stacie D
Home Financials for this Owner
Home Financials are based on the most recent Mortgage that was taken out on this home.
Original Mortgage
$74,700
Interest Rate
7.72%
Create a Home Valuation Report for This Property
The Home Valuation Report is an in-depth analysis detailing your home's value as well as a comparison with similar homes in the area
Home Values in the Area
Average Home Value in this Area
Purchase History
| Date | Buyer | Sale Price | Title Company |
|---|---|---|---|
| Jungers Joel W | $225,000 | First Integrity Title Co | |
| Lenz Mason | $105,000 | Land Title Guarantee Company | |
| Loucks Stacie D | $93,400 | -- |
Source: Public Records
Mortgage History
| Date | Status | Borrower | Loan Amount |
|---|---|---|---|
| Previous Owner | Lenz Mason | $130,000 | |
| Previous Owner | Lenz Mason | $41,000 | |
| Previous Owner | Lenz Mason | $103,098 | |
| Previous Owner | Lenz Mason | $3,092 | |
| Previous Owner | Loucks Stacie D | $81,000 | |
| Previous Owner | Loucks Stacie D | $74,700 |
Source: Public Records
Tax History Compared to Growth
Tax History
| Year | Tax Paid | Tax Assessment Tax Assessment Total Assessment is a certain percentage of the fair market value that is determined by local assessors to be the total taxable value of land and additions on the property. | Land | Improvement |
|---|---|---|---|---|
| 2024 | $1,195 | $15,090 | $2,550 | $12,540 |
| 2023 | $1,169 | $15,090 | $2,550 | $12,540 |
| 2022 | $1,220 | $15,340 | $2,650 | $12,690 |
| 2021 | $1,178 | $15,780 | $2,720 | $13,060 |
| 2020 | $1,198 | $16,140 | $2,550 | $13,590 |
| 2019 | $1,164 | $16,140 | $2,550 | $13,590 |
| 2018 | $1,040 | $13,440 | $2,400 | $11,040 |
| 2017 | $1,037 | $13,440 | $2,400 | $11,040 |
| 2016 | $759 | $9,310 | $2,460 | $6,850 |
| 2015 | $727 | $9,310 | $2,460 | $6,850 |
| 2014 | $582 | $7,010 | $1,489 | $5,521 |
Source: Public Records
Map
Nearby Homes
- 963 Corona St
- 940 N Ogden St
- 1000 N Ogden St
- 1008 N Corona St Unit 607
- 1008 N Corona St Unit 405
- 1008 N Corona St Unit 205
- 1008 N Corona St Unit 204
- 1050 N Corona St Unit 206
- 1050 N Corona St Unit 308
- 1050 N Corona St Unit 316
- 1050 N Corona St Unit 304
- 1050 N Corona St Unit 215
- 999 N Emerson St Unit 9
- 999 N Emerson St Unit 10
- 925 Emerson St
- 1029 E 8th Ave Unit 901
- 1029 E 8th Ave Unit 1302
- 1050 N Clarkson St
- 1056 N Marion St Unit 204
- 1321 E 10th Ave Unit 4
- 985 N Corona St Unit 103
- 985 N Corona St Unit 204
- 985 N Corona St Unit 301
- 985 N Corona St Unit 303
- 985 N Corona St Unit 203
- 985 N Corona St
- 985 N Corona St Unit 302
- 985 N Corona St Unit 101
- 985 N Corona St Unit 104
- 985 N Corona St Unit 102
- 985 Corona St
- 985 Corona St Unit 303
- 985 Corona St
- 985 Corona St Unit 301
- 985 Corona St Unit 204
- 985 Corona St Unit 203
- 985 Corona St Unit 202
- 985 Corona St Unit 201
- 985 Corona St Unit 104
- 985 Corona St Unit 103