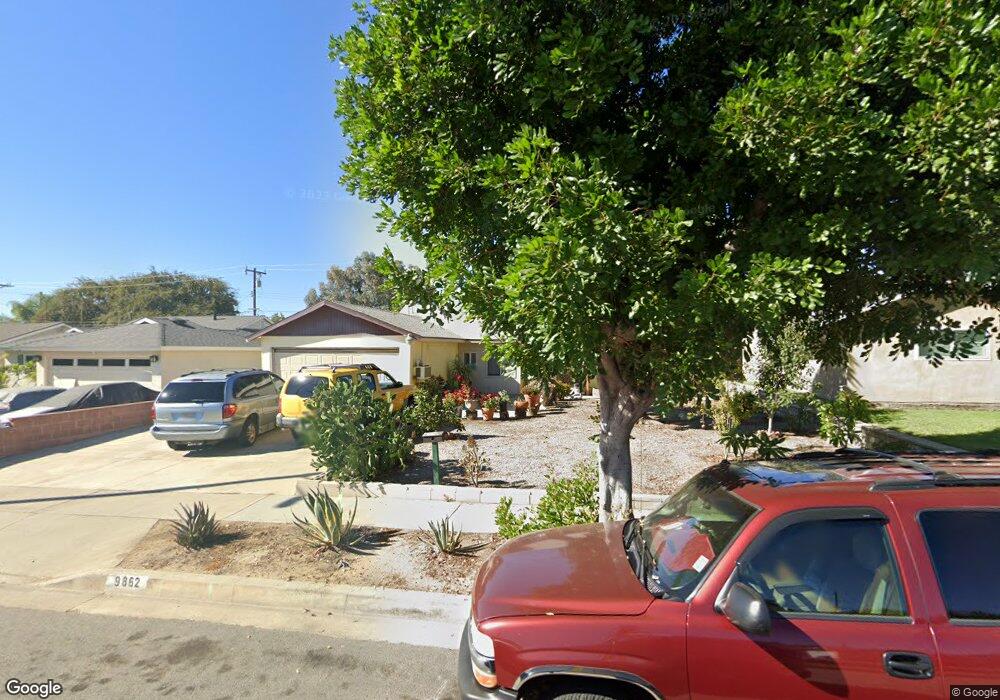
9862 Felipe Ave Montclair, CA 91763
Estimated Value: $596,964 - $702,000
4
Beds
2
Baths
1,328
Sq Ft
$495/Sq Ft
Est. Value
About This Home
This home is located at 9862 Felipe Ave, Montclair, CA 91763 and is currently estimated at $657,741, approximately $495 per square foot. 9862 Felipe Ave is a home located in San Bernardino County with nearby schools including Monte Vista Elementary School, Serrano Middle School, and Montclair High School.
Ownership History
Date
Name
Owned For
Owner Type
Purchase Details
Closed on
Apr 15, 2011
Sold by
Mancias Maria E
Bought by
Mancia Maria E and Quintero Martin
Current Estimated Value
Purchase Details
Closed on
Aug 28, 2006
Sold by
Mancias Maria Elena and Quintero Martin
Bought by
Mancias Maria Elena
Home Financials for this Owner
Home Financials are based on the most recent Mortgage that was taken out on this home.
Original Mortgage
$230,000
Interest Rate
1.5%
Mortgage Type
Negative Amortization
Purchase Details
Closed on
Oct 11, 1996
Sold by
American Svgs Bank Fa
Bought by
Quintero Martin and Quintero Maria Elena
Home Financials for this Owner
Home Financials are based on the most recent Mortgage that was taken out on this home.
Original Mortgage
$116,400
Interest Rate
7.91%
Purchase Details
Closed on
May 15, 1996
Sold by
Ruiz Ernest and Ruiz Anastacio V
Bought by
American Svgs Bank Fa
Create a Home Valuation Report for This Property
The Home Valuation Report is an in-depth analysis detailing your home's value as well as a comparison with similar homes in the area
Home Values in the Area
Average Home Value in this Area
Purchase History
| Date | Buyer | Sale Price | Title Company |
|---|---|---|---|
| Mancia Maria E | -- | None Available | |
| Mancias Maria Elena | -- | Chicago Title Co | |
| Quintero Martin | $117,000 | Investors Title Company | |
| American Svgs Bank Fa | $97,707 | Orange Coast Title |
Source: Public Records
Mortgage History
| Date | Status | Borrower | Loan Amount |
|---|---|---|---|
| Previous Owner | Mancias Maria Elena | $230,000 | |
| Previous Owner | Quintero Martin | $116,400 |
Source: Public Records
Tax History Compared to Growth
Tax History
| Year | Tax Paid | Tax Assessment Tax Assessment Total Assessment is a certain percentage of the fair market value that is determined by local assessors to be the total taxable value of land and additions on the property. | Land | Improvement |
|---|---|---|---|---|
| 2025 | $4,132 | $190,554 | $47,720 | $142,834 |
| 2024 | $4,132 | $186,817 | $46,784 | $140,033 |
| 2023 | $4,075 | $183,154 | $45,867 | $137,287 |
| 2022 | $4,048 | $179,563 | $44,968 | $134,595 |
| 2021 | $4,035 | $176,042 | $44,086 | $131,956 |
| 2020 | $4,078 | $174,237 | $43,634 | $130,603 |
| 2019 | $4,061 | $170,820 | $42,778 | $128,042 |
| 2018 | $1,888 | $167,470 | $41,939 | $125,531 |
| 2017 | $1,820 | $164,187 | $41,117 | $123,070 |
| 2016 | $1,749 | $160,968 | $40,311 | $120,657 |
| 2015 | $1,737 | $158,550 | $39,705 | $118,845 |
| 2014 | $1,683 | $155,444 | $38,927 | $116,517 |
Source: Public Records
Map
Nearby Homes
- 4528 El Morado St
- 9811 Bolton Ave
- 9642 Bolton Ave
- 10593 Mills Ave
- 4861 San Bernardino St
- 10199 Camulos Ave
- 9617 Greenwood Ave
- 4861 Fauna St
- 4219 Fauna St
- 9827 Geneva Ave
- 9382 Shadowood Dr
- 4642 Canoga St
- 126 Bryn Mawr Rd
- 1724 Fellows Place
- 10037 Geneva Ave
- 9386 Mesa Verde Dr Unit B
- 4552 La Deney St
- 9727 Fremont Ave
- 646 Sycamore Ave Unit 18
- 5141 Aspen Dr
- 9874 Felipe Ave
- 9850 Felipe Ave
- 4598 Berkeley St
- 9880 Felipe Ave
- 9855 Felipe Ave
- 9865 Felipe Ave
- 4596 Berkeley St
- 9888 Felipe Ave
- 9843 Felipe Ave
- 9877 Felipe Ave
- 4588 Benito St
- 4611 Berkeley St
- 4603 Berkeley St
- 9859 Camulos Ave
- 9867 Camulos Ave
- 4597 Berkeley St
- 9833 Felipe Ave
- 9849 Camulos Ave
- 9887 Felipe Ave
- 9877 Camulos Ave