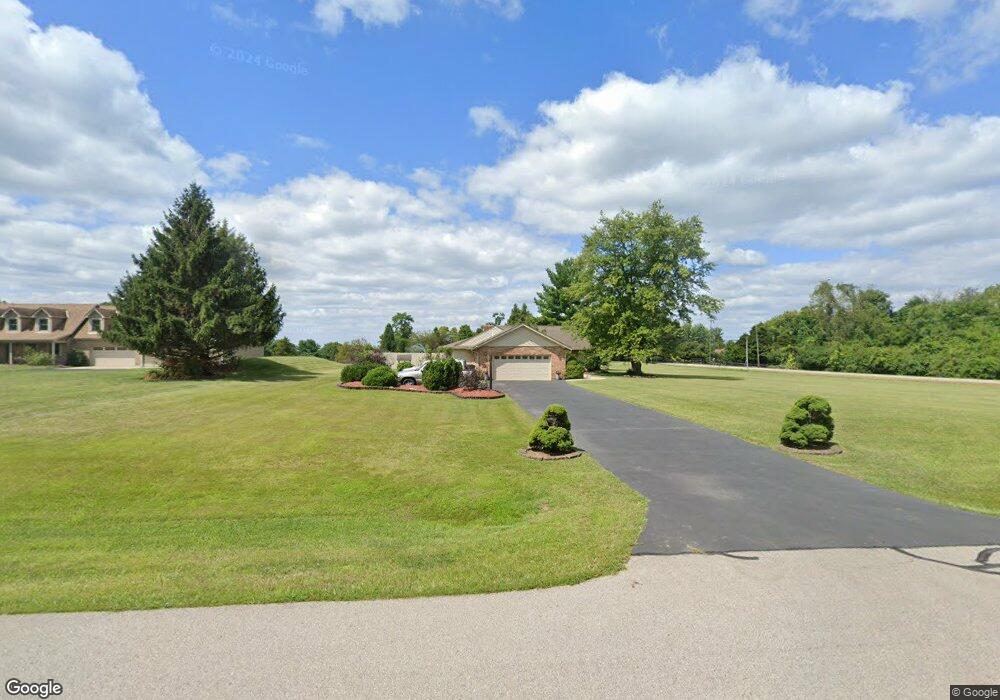
987 Deer Run Trail Lebanon, OH 45036
Turtlecreek Township NeighborhoodEstimated Value: $407,000 - $493,388
3
Beds
3
Baths
1,982
Sq Ft
$232/Sq Ft
Est. Value
About This Home
This home is located at 987 Deer Run Trail, Lebanon, OH 45036 and is currently estimated at $459,597, approximately $231 per square foot. 987 Deer Run Trail is a home located in Warren County with nearby schools including Bowman Primary School, Berry Intermediate School, and Donovan Elementary School.
Ownership History
Date
Name
Owned For
Owner Type
Purchase Details
Closed on
Feb 4, 1999
Sold by
Miller Mark A
Bought by
Newdigate Steve W and Newdigate Sonja V
Current Estimated Value
Home Financials for this Owner
Home Financials are based on the most recent Mortgage that was taken out on this home.
Original Mortgage
$128,000
Outstanding Balance
$30,479
Interest Rate
6.81%
Mortgage Type
New Conventional
Estimated Equity
$429,118
Purchase Details
Closed on
Dec 18, 1998
Sold by
Ross Loland C
Bought by
Miller Mark A
Home Financials for this Owner
Home Financials are based on the most recent Mortgage that was taken out on this home.
Original Mortgage
$128,000
Outstanding Balance
$30,479
Interest Rate
6.81%
Mortgage Type
New Conventional
Estimated Equity
$429,118
Purchase Details
Closed on
Mar 13, 1987
Sold by
Johnson Roger and Johnson Margie
Bought by
Ross and Ross Leland C
Purchase Details
Closed on
Jul 31, 1986
Sold by
Johnson Roger and Johnson Margie
Bought by
Johnson and Johnson Roger
Create a Home Valuation Report for This Property
The Home Valuation Report is an in-depth analysis detailing your home's value as well as a comparison with similar homes in the area
Home Values in the Area
Average Home Value in this Area
Purchase History
| Date | Buyer | Sale Price | Title Company |
|---|---|---|---|
| Newdigate Steve W | $160,000 | -- | |
| Miller Mark A | $130,000 | -- | |
| Ross | $17,000 | -- | |
| Johnson | -- | -- |
Source: Public Records
Mortgage History
| Date | Status | Borrower | Loan Amount |
|---|---|---|---|
| Open | Newdigate Steve W | $128,000 |
Source: Public Records
Tax History Compared to Growth
Tax History
| Year | Tax Paid | Tax Assessment Tax Assessment Total Assessment is a certain percentage of the fair market value that is determined by local assessors to be the total taxable value of land and additions on the property. | Land | Improvement |
|---|---|---|---|---|
| 2024 | $4,933 | $124,240 | $35,450 | $88,790 |
| 2023 | $4,184 | $95,200 | $19,568 | $75,631 |
| 2022 | $4,132 | $95,200 | $19,569 | $75,632 |
| 2021 | $3,834 | $95,200 | $19,569 | $75,632 |
| 2020 | $3,900 | $80,679 | $16,583 | $64,096 |
| 2019 | $3,922 | $80,679 | $16,583 | $64,096 |
| 2018 | $3,543 | $80,679 | $16,583 | $64,096 |
| 2017 | $3,858 | $78,855 | $16,482 | $62,374 |
| 2016 | $3,988 | $78,855 | $16,482 | $62,374 |
| 2015 | $4,020 | $78,855 | $16,482 | $62,374 |
| 2014 | $3,840 | $71,920 | $15,220 | $56,700 |
| 2013 | $3,835 | $79,410 | $16,580 | $62,830 |
Source: Public Records
Map
Nearby Homes
- 1539 Oregonia Rd
- 2696 Wilmington Rd
- 3841 Wilmington Rd
- 137 S Waynesville Rd
- 0 N Liberty Keuter Rd Unit 944632
- 0 N Liberty Keuter Rd Unit 1856762
- 2361 Wilmington Rd
- 2130 N Liberty Keuter Rd
- 2832 Abby Ln
- 1105 Mockingbird Ln
- 4363 Hollingsworth Rd
- 1538 Oregonia Rd
- 73Ac. Walmart Dr
- 339 S Nixon Camp Rd
- 2722 N US Route 42
- 2722 U S 42
- 1 Corwin Rd
- 6 Corwin Rd
- 2901 Shoemaker Rd
- 355 Summit St
- 969 Deer Run Trail
- 961 Deer Run Trail
- 3117 Oregonia Rd
- 3180 Oregonia Rd
- 992 Deer Run Trail
- 3120 Oregonia Rd
- 970 Deer Run Trail
- 931 Deer Run Trail
- 3112 Oregonia Rd
- 954 Deer Run Trail
- 893 Deer Run Trail
- 936 Deer Run Trail
- 593 Deer Run Trail
- 921 Deer Run Trail
- 1060 Melayn St
- 1030 Melayn St
- 1098 Melayn St
- 619 Deer Run Trail
- 912 Deer Run Trail
- 2 Oregonia Rd