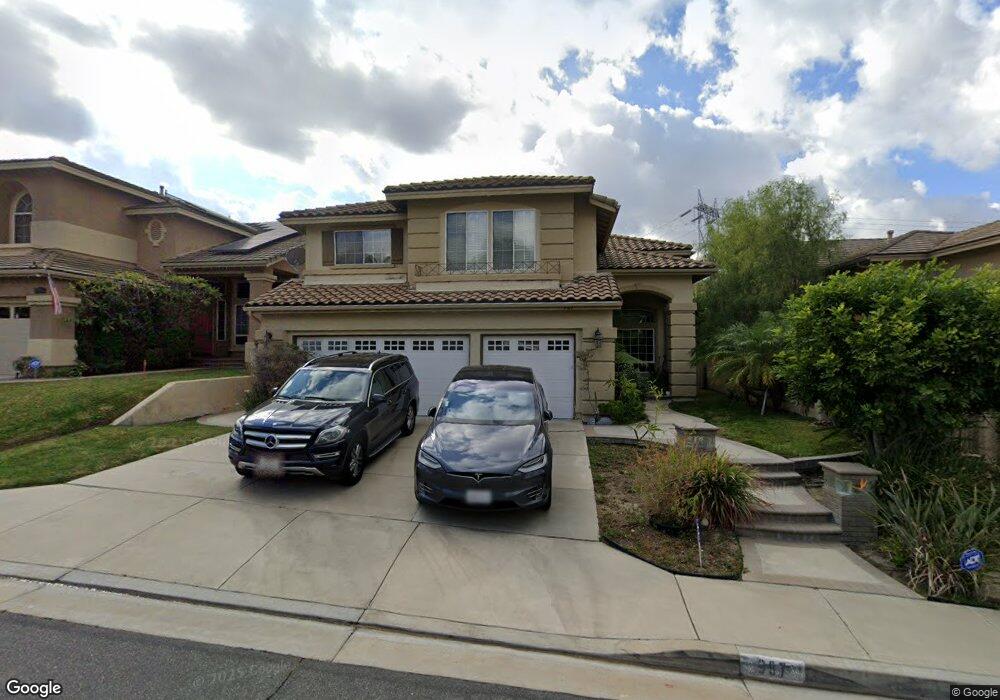
987 S Creekview Ln Anaheim, CA 92808
Anaheim Hills NeighborhoodEstimated Value: $1,546,599 - $1,703,000
3
Beds
3
Baths
2,857
Sq Ft
$582/Sq Ft
Est. Value
About This Home
This home is located at 987 S Creekview Ln, Anaheim, CA 92808 and is currently estimated at $1,662,400, approximately $581 per square foot. 987 S Creekview Ln is a home located in Orange County with nearby schools including Canyon Rim Elementary, Canyon High School, and El Rancho Charter.
Ownership History
Date
Name
Owned For
Owner Type
Purchase Details
Closed on
Jun 28, 2019
Sold by
Amin Alpesh Navin and Amin Sonali Alpesh
Bought by
Amin Alpesh Navin and Amin Sonali Alpesh
Current Estimated Value
Purchase Details
Closed on
Mar 20, 2014
Sold by
Amin Alpesh Navin
Bought by
Amin Alpesh Navin and Amin Sonali Alpesh
Purchase Details
Closed on
May 8, 2002
Sold by
Ling Robert M and Ling Heidi E
Bought by
Amin Alpesh N
Home Financials for this Owner
Home Financials are based on the most recent Mortgage that was taken out on this home.
Original Mortgage
$420,000
Interest Rate
6%
Purchase Details
Closed on
Mar 25, 1996
Sold by
Presley Homes
Bought by
Ling Robert M and Ling Heidi E
Home Financials for this Owner
Home Financials are based on the most recent Mortgage that was taken out on this home.
Original Mortgage
$207,000
Interest Rate
8.09%
Create a Home Valuation Report for This Property
The Home Valuation Report is an in-depth analysis detailing your home's value as well as a comparison with similar homes in the area
Home Values in the Area
Average Home Value in this Area
Purchase History
| Date | Buyer | Sale Price | Title Company |
|---|---|---|---|
| Amin Alpesh Navin | -- | None Available | |
| Amin Alpesh Navin | -- | None Available | |
| Amin Alpesh Navin | -- | None Available | |
| Amin Alpesh N | $530,000 | Southland Title Corporation | |
| Amin Alpesh N | -- | -- | |
| Ling Robert M | $318,000 | First American Title Ins |
Source: Public Records
Mortgage History
| Date | Status | Borrower | Loan Amount |
|---|---|---|---|
| Previous Owner | Amin Alpesh N | $420,000 | |
| Previous Owner | Ling Robert M | $207,000 | |
| Closed | Ling Robert M | $75,000 |
Source: Public Records
Tax History Compared to Growth
Tax History
| Year | Tax Paid | Tax Assessment Tax Assessment Total Assessment is a certain percentage of the fair market value that is determined by local assessors to be the total taxable value of land and additions on the property. | Land | Improvement |
|---|---|---|---|---|
| 2025 | $8,433 | $782,961 | $370,815 | $412,146 |
| 2024 | $8,433 | $767,609 | $363,544 | $404,065 |
| 2023 | $8,246 | $752,558 | $356,415 | $396,143 |
| 2022 | $8,086 | $737,802 | $349,426 | $388,376 |
| 2021 | $7,858 | $723,336 | $342,575 | $380,761 |
| 2020 | $7,785 | $715,920 | $339,063 | $376,857 |
| 2019 | $7,685 | $701,883 | $332,415 | $369,468 |
| 2018 | $7,567 | $688,121 | $325,897 | $362,224 |
| 2017 | $7,249 | $674,629 | $319,507 | $355,122 |
| 2016 | $7,107 | $661,401 | $313,242 | $348,159 |
| 2015 | $6,942 | $651,467 | $308,537 | $342,930 |
| 2014 | $6,865 | $638,706 | $302,493 | $336,213 |
Source: Public Records
Map
Nearby Homes
- 951 S Creekview Ln
- 414 S Cooks Corner
- 760 S Thrasher Way
- 965 S Dylan Way
- 719 S Goldfinch Way
- 7653 E Corto Rd
- 712 S Lost Canyon Rd
- 1010 S Gibraltar Ave Unit 375
- 7583 E Country Hill Ln
- 7750 E Portofino Ave
- 316 S Penny Ln
- 312 S Penny Ln
- 309 S Penny Ln
- 7912 E Monte Carlo Ave
- 7859 E Quinn Dr
- 6587 E Via Arboles
- 6554 E Via Estrada
- 950 S Rim Crest Dr Unit 12
- 949 S Ridgecrest Cir
- 7921 E Quinn Dr
- 991 S Creekview Ln
- 983 S Creekview Ln
- 995 S Creekview Ln
- 979 S Creekview Ln
- 999 S Creekview Ln
- 975 S Creekview Ln
- 7505 E Toyon Ln
- 1009 S Creekview Ln
- 988 S Creekview Ln
- 971 S Creekview Ln
- 1017 S Creekview Ln
- 7525 E Toyon Ln
- 984 S Creekview Ln
- 7500 E Toyon Ln
- 967 S Creekview Ln
- 1025 S Creekview Ln
- 980 S Creekview Ln
- 7545 E Toyon Ln
- 7520 E Toyon Ln
- 976 S Creekview Ln