
9872 Highland Ave Unit B Rancho Cucamonga, CA 91737
Estimated payment $2,972/month
Total Views
137
2
Beds
2
Baths
996
Sq Ft
$451
Price per Sq Ft
Highlights
- Spa
- Neighborhood Views
- 2 Car Attached Garage
- Deer Canyon Elementary Rated A-
- Tennis Courts
- Living Room
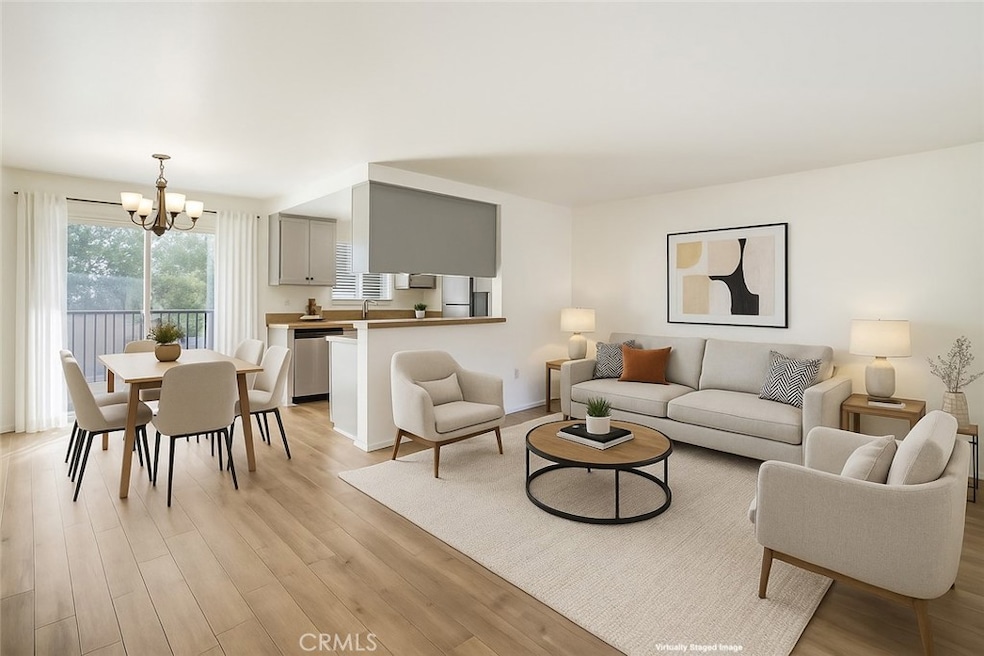
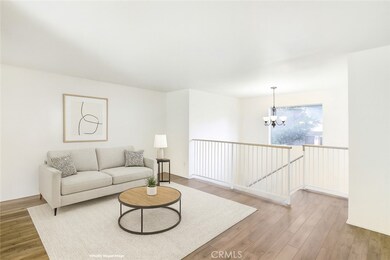
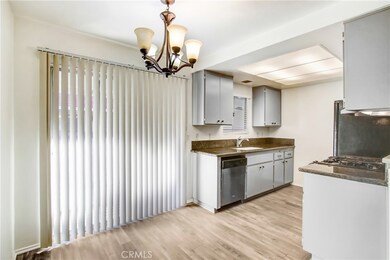
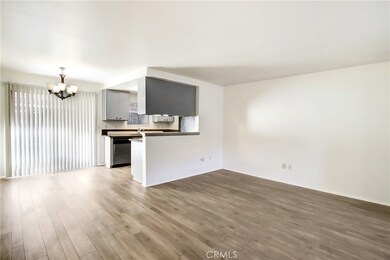
About This Home
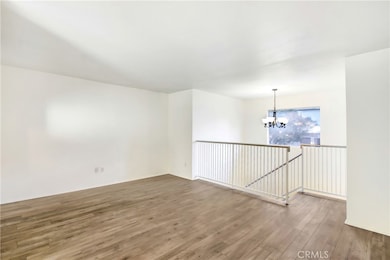
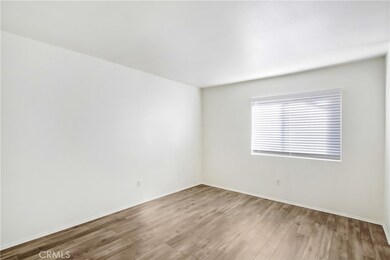
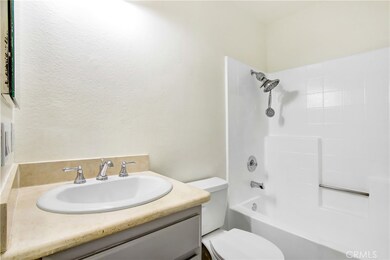
Welcome to 9872 Highland Ave - Unit B. This bright and private upstairs home feels comfortable the moment you walk in. Fresh interior paint and brand new laminate flooring create a clean and modern look throughout. All of your living space is on one spacious level above, featuring an open living and dining area, two well sized bedrooms, and two full bathrooms for plenty of comfort and privacy. You will also enjoy direct access to your own two car garage below, which is a rare bonus for storage, security, and easy parking. Step out onto your private balcony, a perfect spot for morning coffee or a little fresh air at the end of the day. The gated community includes resort style amenities such as a sparkling pool, tennis court, picnic areas, and a neighborhood park. You are close to shopping, dining, and have quick access to the two ten freeway for an easy commute. This home is a great blend of comfort, convenience, and value.
Listing Agent
COMPASS Brokerage Phone: 909-402-3523 License #01951620 Listed on: 11/28/2025
Property Details
Home Type
- Condominium
Est. Annual Taxes
- $2,915
Year Built
- Built in 1988
HOA Fees
- $365 Monthly HOA Fees
Parking
- 2 Car Attached Garage
- Automatic Gate
Home Design
- Entry on the 1st floor
Interior Spaces
- 996 Sq Ft Home
- 2-Story Property
- Blinds
- Living Room
- Laminate Flooring
- Neighborhood Views
Bedrooms and Bathrooms
- 2 Main Level Bedrooms
- All Upper Level Bedrooms
- 2 Full Bathrooms
Laundry
- Laundry Room
- Laundry in Garage
Schools
- Vineyard Middle School
- Los Osos High School
Additional Features
- Spa
- Two or More Common Walls
- Suburban Location
- Central Heating and Cooling System
Listing and Financial Details
- Tax Lot 2
- Tax Tract Number 17745
- Assessor Parcel Number 0201396070000
- $390 per year additional tax assessments
- Seller Considering Concessions
Community Details
Overview
- 60 Units
- Foothill Highland HOA, Phone Number (909) 941-0201
- City Commercial Management HOA
Amenities
- Community Barbecue Grill
- Picnic Area
Recreation
- Tennis Courts
- Community Playground
- Community Pool
- Community Spa
Map
Create a Home Valuation Report for This Property
The Home Valuation Report is an in-depth analysis detailing your home's value as well as a comparison with similar homes in the area
Home Values in the Area
Average Home Value in this Area
Tax History
| Year | Tax Paid | Tax Assessment Tax Assessment Total Assessment is a certain percentage of the fair market value that is determined by local assessors to be the total taxable value of land and additions on the property. | Land | Improvement |
|---|---|---|---|---|
| 2025 | $2,915 | $257,554 | $64,390 | $193,164 |
| 2024 | $2,915 | $252,503 | $63,127 | $189,376 |
| 2023 | $2,852 | $247,552 | $61,889 | $185,663 |
| 2022 | $2,845 | $242,698 | $60,675 | $182,023 |
| 2021 | $2,844 | $237,939 | $59,485 | $178,454 |
| 2020 | $2,732 | $235,499 | $58,875 | $176,624 |
| 2019 | $2,762 | $230,882 | $57,721 | $173,161 |
| 2018 | $2,703 | $226,355 | $56,589 | $169,766 |
| 2017 | $2,585 | $221,916 | $55,479 | $166,437 |
| 2016 | $2,518 | $217,565 | $54,391 | $163,174 |
| 2015 | $2,503 | $214,297 | $53,574 | $160,723 |
| 2014 | $2,436 | $210,100 | $52,525 | $157,575 |
Source: Public Records
Property History
| Date | Event | Price | List to Sale | Price per Sq Ft |
|---|---|---|---|---|
| 11/28/2025 11/28/25 | For Sale | $449,000 | -- | $451 / Sq Ft |
Source: California Regional Multiple Listing Service (CRMLS)
Purchase History
| Date | Type | Sale Price | Title Company |
|---|---|---|---|
| Grant Deed | $200,000 | Chicago Title Company |
Source: Public Records
About the Listing Agent
Located in Rancho Cucamonga and serving the Inland Empire and surrounding cities with over a decade of experience in Real Estate, Aaron specializes in helping clients buy and sell high-end homes with ease and confidence. Backed by a background in 5-star hospitality, he delivers exceptional service, personalized guidance, and a seamless experience from start to finish. Aaron’s proven marketing strategies, combined with his commitment to transparency and integrity, consistently deliver standout
Aaron's Other Listings
Source: California Regional Multiple Listing Service (CRMLS)
MLS Number: CV25267438
APN: 0201-396-07
Disclaimer: Certain information contained herein is derived from information provided by parties other than Homes.com. All information provided is deemed reliable, but is not guaranteed to be accurate and should be independently verified.
![]() The multiple listing data appearing on this website, or contained in reports produced therefrom, is owned and copyrighted by California Regional Multiple Listing Service, Inc. ("CRMLS") and is protected by all applicable copyright laws. Information provided is for viewer's personal, non-commercial use and may not be used for any purpose other than to identify prospective properties the viewer may be interested in purchasing. All listing data, including but not limited to square footage and lot size is believed to be accurate, but the listing Agent, listing Broker and CRMLS and its affiliates do not warrant or guarantee such accuracy. The viewer should independently verify the listed data prior to making any decisions based on such information by personal inspection and/or contacting a real estate professional.
The multiple listing data appearing on this website, or contained in reports produced therefrom, is owned and copyrighted by California Regional Multiple Listing Service, Inc. ("CRMLS") and is protected by all applicable copyright laws. Information provided is for viewer's personal, non-commercial use and may not be used for any purpose other than to identify prospective properties the viewer may be interested in purchasing. All listing data, including but not limited to square footage and lot size is believed to be accurate, but the listing Agent, listing Broker and CRMLS and its affiliates do not warrant or guarantee such accuracy. The viewer should independently verify the listed data prior to making any decisions based on such information by personal inspection and/or contacting a real estate professional.
Based on information from California Regional Multiple Listing Service, Inc. and /or other sources. All data, including all measurements and calculations of area, is obtained from various sources and has not been, and will not be, verified by broker or MLS. All information should be independently reviewed and verified for accuracy. Properties may or may not be listed by the office/agent presenting the information
Nearby Homes
- 9872 Highland Ave Unit D
- 6360 Calle Hermoso
- 6349 Daylily Ct
- 6616 Brighton Place
- 6740 London Ave
- 6210 Phillips Way
- 9637 Apricot Ave
- 10123 Finch Ave
- 6765 Jadeite Ave
- 10141 Orange St
- 6644 Brissac Place
- 6155 Klusman Ave
- 6154 Klusman Ave
- 10040 Jonquil Dr
- 10121 Banyan St
- 6281 Kinlock Ave
- 6931 Berkshire Ave
- 6880 Archibald Ave Unit 114
- 6880 Archibald Ave Unit 82
- 6880 Archibald Ave Unit 27
- 6488 Caledon Place
- 9742 Willow Wood Dr
- 6653 Canary Pine Ave
- 9661 Northampton Dr
- 6220 Filkins Ave
- 6628 Amethyst St
- 6210 Halstead Ave
- 9356 19th St Unit D
- 9617 Monte Vista St Unit A
- 7004 Amethyst Ave Unit 3
- 7004 Amethyst Ave Unit 2
- 9600 Lomita Ct
- 10237 Kernwood Ct
- 9601 Lomita Ct
- 10655 Lemon Ave
- 10655 Lemon Ave Unit 3310
- 10655 Lemon Ave Unit 1710
- 10655 Lemon Ave Unit 3912
- 8990 19th St Unit 304
- 10757 Lemon Ave