Estimated Value: $228,000 - $236,000
2
Beds
1
Bath
636
Sq Ft
$367/Sq Ft
Est. Value
About This Home
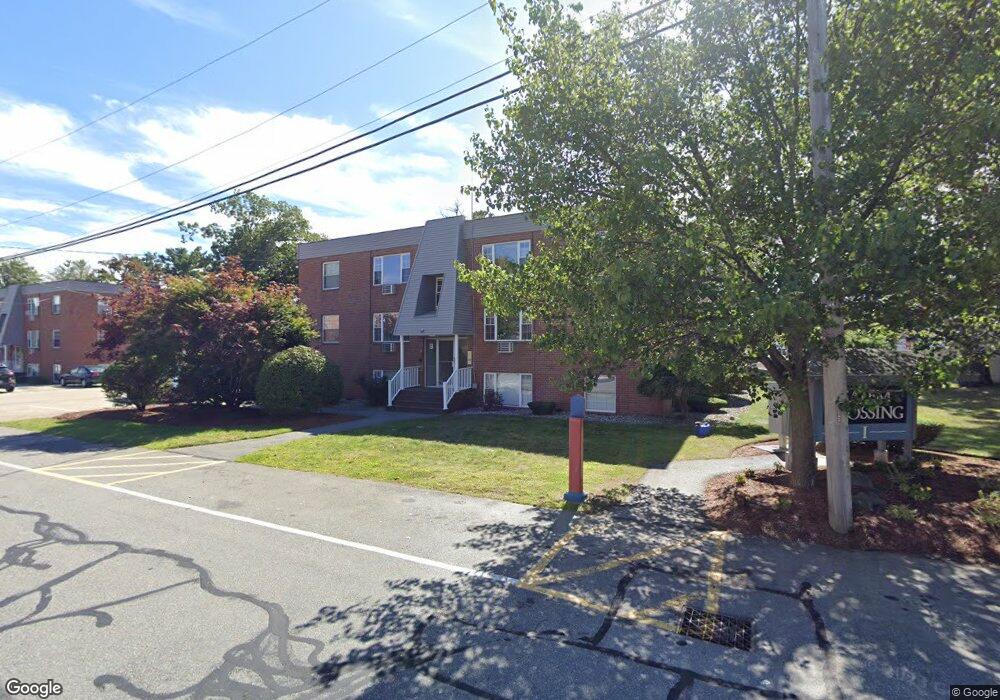
This home is located at 99 Cluff Crossing Rd Unit F1, Salem, NH 03079 and is currently estimated at $233,204, approximately $366 per square foot. 99 Cluff Crossing Rd Unit F1 is a home located in Rockingham County with nearby schools including Dr. L.F. Soule School, Woodbury School, and Salem High School.
Ownership History
Date
Name
Owned For
Owner Type
Purchase Details
Closed on
Apr 10, 2020
Sold by
Santos Jonathan and Valentin Isabel
Bought by
Rosario Merys M
Current Estimated Value
Home Financials for this Owner
Home Financials are based on the most recent Mortgage that was taken out on this home.
Original Mortgage
$96,000
Outstanding Balance
$84,720
Interest Rate
3.2%
Mortgage Type
Purchase Money Mortgage
Estimated Equity
$148,484
Purchase Details
Closed on
Feb 8, 2018
Sold by
Cluff F1 Rt
Bought by
Santos Jonathan and Valentin Isabel
Home Financials for this Owner
Home Financials are based on the most recent Mortgage that was taken out on this home.
Original Mortgage
$85,000
Interest Rate
3.99%
Purchase Details
Closed on
Apr 20, 2012
Sold by
Felix Annette A
Bought by
Cluff F1 Rt
Purchase Details
Closed on
Sep 29, 2011
Sold by
Chin-Michalosky Ginny S and Downling Paul F
Bought by
Felix Annette
Purchase Details
Closed on
Nov 4, 1998
Sold by
Berube Michael E
Bought by
Chin Ginny S
Create a Home Valuation Report for This Property
The Home Valuation Report is an in-depth analysis detailing your home's value as well as a comparison with similar homes in the area
Home Values in the Area
Average Home Value in this Area
Purchase History
| Date | Buyer | Sale Price | Title Company |
|---|---|---|---|
| Rosario Merys M | $120,000 | None Available | |
| Santos Jonathan | $85,000 | -- | |
| Cluff F1 Rt | -- | -- | |
| Felix Annette | $55,000 | -- | |
| Chin Ginny S | $21,000 | -- |
Source: Public Records
Mortgage History
| Date | Status | Borrower | Loan Amount |
|---|---|---|---|
| Open | Rosario Merys M | $96,000 | |
| Previous Owner | Santos Jonathan | $85,000 |
Source: Public Records
Tax History Compared to Growth
Tax History
| Year | Tax Paid | Tax Assessment Tax Assessment Total Assessment is a certain percentage of the fair market value that is determined by local assessors to be the total taxable value of land and additions on the property. | Land | Improvement |
|---|---|---|---|---|
| 2024 | $2,309 | $131,200 | $0 | $131,200 |
| 2023 | $2,225 | $131,200 | $0 | $131,200 |
| 2022 | $2,106 | $131,200 | $0 | $131,200 |
| 2021 | $2,097 | $131,200 | $0 | $131,200 |
| 2020 | $1,396 | $63,400 | $0 | $63,400 |
| 2019 | $1,394 | $63,400 | $0 | $63,400 |
| 2018 | $1,370 | $63,400 | $0 | $63,400 |
| 2017 | $1,321 | $63,400 | $0 | $63,400 |
| 2016 | $1,295 | $63,400 | $0 | $63,400 |
| 2015 | $1,388 | $64,900 | $0 | $64,900 |
| 2014 | $1,349 | $64,900 | $0 | $64,900 |
| 2013 | $1,328 | $64,900 | $0 | $64,900 |
Source: Public Records
Map
Nearby Homes
- 6 Lancelot Ct Unit 2
- 11 Tiffany Rd Unit 1
- 117 Cluff Crossing Rd Unit 7
- 59 Cluff Rd Unit 50
- 59 Cluff Rd Unit 7
- 59 Cluff Rd Unit 41
- 30 Hagop Rd
- 12 Braemoor Woods Rd Unit 206
- 11 Maclarnon Rd
- 17 Meredith Rd
- 146 S Policy St
- 4 Mulberry Rd
- 10 Brady Ave
- 15 Linwood Ave
- 75 S Policy St Unit 45
- 75 S Policy St Unit 48
- 89 End St
- 8 Senter St
- 55 Crestwood Cir
- 10 Sally Sweets Way Unit V104
- 99 Cluff Crossing Rd Unit B-01
- 99 Cluff Crossing Rd Unit 1
- 99 Cluff Crossing Rd Unit F12
- 99 Cluff Crossing Rd Unit F11
- 99 Cluff Crossing Rd Unit F10
- 99 Cluff Crossing Rd Unit F9
- 99 Cluff Crossing Rd Unit F8
- 99 Cluff Crossing Rd Unit F7
- 99 Cluff Crossing Rd Unit F6
- 99 Cluff Crossing Rd Unit F5
- 99 Cluff Crossing Rd Unit F4
- 99 Cluff Crossing Rd Unit F3
- 99 Cluff Crossing Rd Unit E12
- 99 Cluff Crossing Rd Unit E11
- 99 Cluff Crossing Rd Unit E10
- 99 Cluff Crossing Rd Unit E9
- 99 Cluff Crossing Rd Unit E8
- 99 Cluff Crossing Rd Unit E7
- 99 Cluff Crossing Rd Unit E6
- 99 Cluff Crossing Rd Unit E5