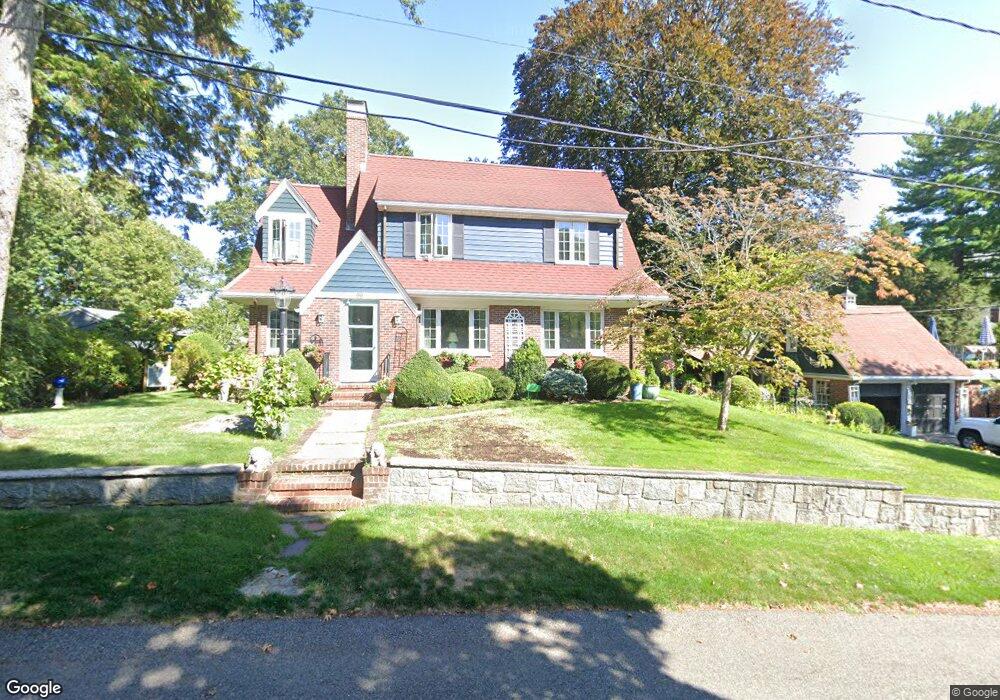
99 Colby Rd Braintree, MA 02184
North Braintree NeighborhoodEstimated Value: $972,000 - $1,194,000
3
Beds
2
Baths
2,711
Sq Ft
$393/Sq Ft
Est. Value
About This Home
This home is located at 99 Colby Rd, Braintree, MA 02184 and is currently estimated at $1,066,583, approximately $393 per square foot. 99 Colby Rd is a home located in Norfolk County with nearby schools including Braintree High School, Sacred Heart Elementary School, and Thayer Academy.
Ownership History
Date
Name
Owned For
Owner Type
Purchase Details
Closed on
Aug 1, 2002
Sold by
Stolp Judith A
Bought by
Mosesso Joseph F and Mosesso Catherine M
Current Estimated Value
Home Financials for this Owner
Home Financials are based on the most recent Mortgage that was taken out on this home.
Original Mortgage
$300,000
Outstanding Balance
$127,761
Interest Rate
6.64%
Mortgage Type
Purchase Money Mortgage
Estimated Equity
$938,822
Create a Home Valuation Report for This Property
The Home Valuation Report is an in-depth analysis detailing your home's value as well as a comparison with similar homes in the area
Home Values in the Area
Average Home Value in this Area
Purchase History
| Date | Buyer | Sale Price | Title Company |
|---|---|---|---|
| Mosesso Joseph F | $499,900 | -- |
Source: Public Records
Mortgage History
| Date | Status | Borrower | Loan Amount |
|---|---|---|---|
| Open | Mosesso Joseph F | $300,000 |
Source: Public Records
Tax History Compared to Growth
Tax History
| Year | Tax Paid | Tax Assessment Tax Assessment Total Assessment is a certain percentage of the fair market value that is determined by local assessors to be the total taxable value of land and additions on the property. | Land | Improvement |
|---|---|---|---|---|
| 2025 | $9,767 | $978,700 | $433,600 | $545,100 |
| 2024 | $8,893 | $938,100 | $399,300 | $538,800 |
| 2023 | $8,558 | $876,800 | $365,100 | $511,700 |
| 2022 | $8,270 | $831,200 | $319,500 | $511,700 |
| 2021 | $7,694 | $773,300 | $288,700 | $484,600 |
| 2020 | $7,178 | $728,000 | $262,400 | $465,600 |
| 2019 | $7,035 | $697,200 | $262,400 | $434,800 |
| 2018 | $6,816 | $646,700 | $228,200 | $418,500 |
| 2017 | $6,492 | $604,500 | $228,200 | $376,300 |
| 2016 | $6,231 | $567,500 | $205,400 | $362,100 |
| 2015 | $6,104 | $551,400 | $200,800 | $350,600 |
| 2014 | $5,799 | $507,800 | $180,300 | $327,500 |
Source: Public Records
Map
Nearby Homes
- 305 Franklin St
- 6 Oak St
- 78 Windemere Cir
- 37 Monatiquot Ave
- 491 Washington St Unit 1
- 47 Addison St
- 63 Dickerman Ln
- 29 Joseph Rd
- 6 Franklin St
- 7 Carter Rd
- 80 Lake St
- 414 John Mahar Hwy Unit 402
- 9 Independence Ave Unit 307
- 418 John Mahar Hwy Unit 408
- 72 Armstrong Cir
- 605 Middle St Unit 38
- 428 John Mahar Hwy Unit 301
- 808 Willard St Unit F11
- 39 Morrison Rd
- 106 Home Park Rd