
Seller's Agent in 2019
Monica Brashear
Martha Turner Sotheby's International Realty - The Woodlands
(832) 381-6742
7 in this area
146 Total Sales

Estimated Value: $1,959,000 - $2,255,693
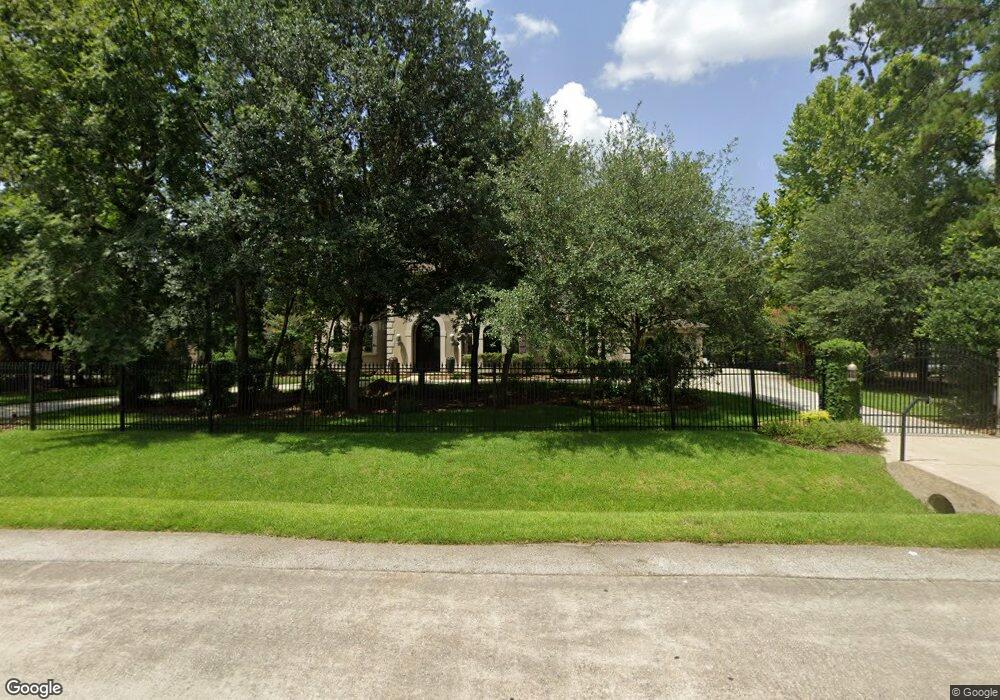
This sprawling custom estate is nestled onto a 2 acre private and gated lot in one of The Woodlands' premier neighborhoods. Enter the home & you'll notice fresh light paint & soaring ceilings, surrounded by sweeping formals, handsome private study & stunning views of the resort-style backyard. The 80,000 gallon pool was featured on HGTV! Its natural stone slabs, 4 waterfalls, and 30' slide will be the envy of the neighborhood. Large firepit and summer kitchen top it off! Perfect for entertaining! The family room is the heart of the home, open to the breakfast room & chef's kitchen, complete w/ professional grade appliances, all overlooking the private acreage. The master suite & secondary bedroom are privately situated on separate wings of the main level. The master suite features 2 separate walk in closets! The 2nd floor boasts a large media room, work out room, gameroom & covered balcony w/ fantastic views, along with 3 secondary bedrooms with ensuite baths. 4 car oversized garage!
Last Agent to Sell the Property
Martha Turner Sotheby's International Realty - The Woodlands License #0622808 Listed on: 04/15/2019
| Date | Buyer | Sale Price | Title Company |
|---|---|---|---|
| Mandava Somasundaram S | -- | None Available | |
| Ross Kimberly Ann | -- | Fidelity National Title | |
| Mitchell Flint | -- | Texas American Title Company | |
| Partners In Building Lp | -- | Texas American Title Company |
| Date | Status | Borrower | Loan Amount |
|---|---|---|---|
| Previous Owner | Ross Kimberly Ann | $976,000 | |
| Previous Owner | Mitchell Flint | $417,000 |
| Date | Event | Price | List to Sale | Price per Sq Ft |
|---|---|---|---|---|
| 10/06/2024 10/06/24 | Off Market | -- | -- | -- |
| 11/06/2019 11/06/19 | Sold | -- | -- | -- |
| 10/07/2019 10/07/19 | Pending | -- | -- | -- |
| 04/15/2019 04/15/19 | For Sale | $1,699,999 | -- | $270 / Sq Ft |
| Year | Tax Paid | Tax Assessment Tax Assessment Total Assessment is a certain percentage of the fair market value that is determined by local assessors to be the total taxable value of land and additions on the property. | Land | Improvement |
|---|---|---|---|---|
| 2025 | $29,104 | $1,941,410 | -- | -- |
| 2024 | $28,797 | $1,764,918 | $300,000 | $1,464,918 |
| 2023 | $28,797 | $1,737,570 | $300,000 | $1,446,880 |
| 2022 | $31,921 | $1,579,610 | $300,000 | $1,446,880 |
| 2021 | $31,329 | $1,436,010 | $62,400 | $1,373,610 |
| 2020 | $32,848 | $1,442,000 | $62,400 | $1,379,600 |
| 2019 | $41,484 | $1,762,110 | $62,400 | $1,699,710 |
| 2018 | $38,540 | $1,762,110 | $62,400 | $1,699,710 |
| 2017 | $42,000 | $1,762,110 | $62,400 | $1,699,710 |
| 2016 | $42,000 | $1,762,110 | $62,400 | $1,699,710 |
| 2015 | $34,041 | $1,670,180 | $62,400 | $1,607,780 |
| 2014 | $34,041 | $1,416,820 | $62,400 | $1,434,950 |
Seller's Agent in 2019
Monica Brashear
Martha Turner Sotheby's International Realty - The Woodlands
(832) 381-6742
7 in this area
146 Total Sales
K
Buyer's Agent in 2019
Kathleen Merchant
Compass RE Texas, LLC - The Woodlands
(713) 203-8448
7 in this area
77 Total Sales
Source: Houston Association of REALTORS®
MLS Number: 97474340
APN: 9728-61-01300
Disclaimer: Certain information contained herein is derived from information provided by parties other than Homes.com. All information provided is deemed reliable, but is not guaranteed to be accurate and should be independently verified.
![]() Copyright 2026, Houston REALTORS® Information Service, Inc.
Copyright 2026, Houston REALTORS® Information Service, Inc.
The information provided is exclusively for consumers’ personal, non-commercial use, and may not be used for any purpose other than to identify prospective properties consumers may be interested in purchasing.
Information is deemed reliable but not guaranteed.
Ask me questions while you tour the home.